IMAGE

Fig 4

ID
ZDB-IMAGE-260413-51
Genes
Publication
Emond et al., 2026 - Characterization of a C9orf72 Knockout Danio rerio model for ALS and cross-species validation of potential therapeutics screened in Caenorhabditis elegans
All Figures
Figures for Emond et al., 2026
Image
Figure Caption

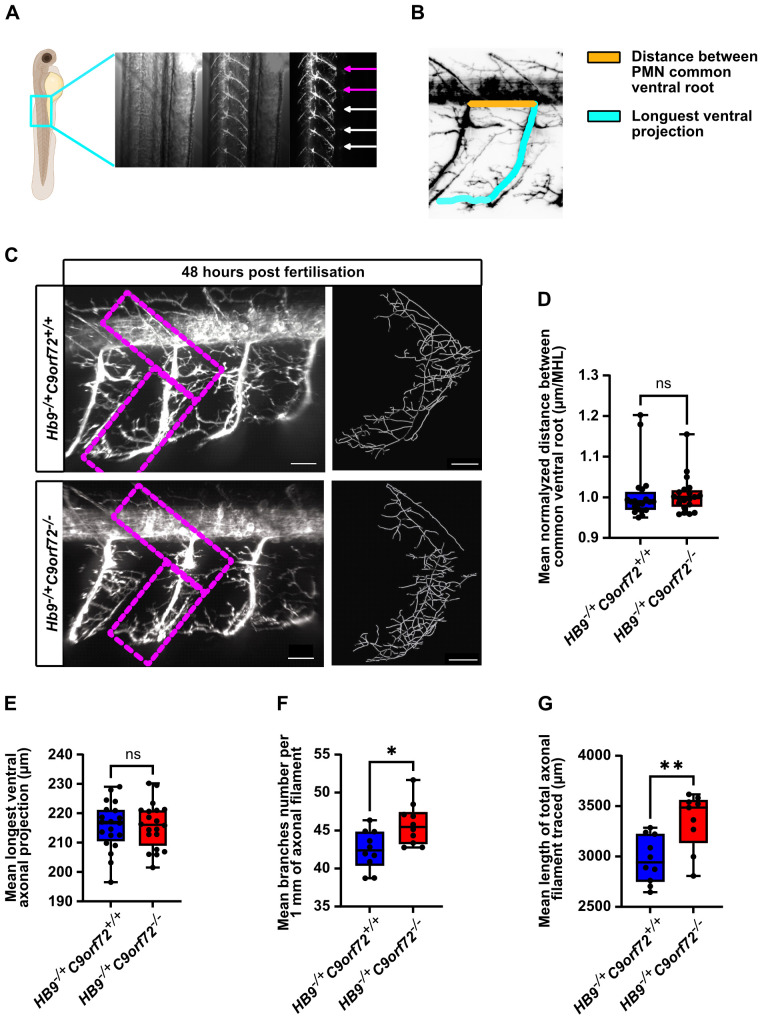
Fig 4 Complete loss of C9orf72 leads to mild axonal over-branching of spinal primary motor neurons.

(A) Schematic representation of the dorsal primary motor neuron (PMN) units analyzed for measurements of the common ventral root distance (VRD), longest ventral axonal filament (LVF), and 3D axonal filament tracing in Hb9-/+C9orf72+/+ and Hb9-/+C9orf72-/- larvae at 48 hours post-fertilization (hpf). (B) Schematic depiction of VRD and LVF measurements, illustrating how the distance between the common PMN’s ventral root and the longest projecting axonal filament were quantified. (C) Representative confocal image of a spinal hemisegment PMN unit and corresponding 3D axonal filament tracing used to assess axonal branching. Dashed lines indicate the area considered for filament tracing. (D, E) Quantitative analysis of mean VRD (D) and mean LVF (E) revealed no significant differences between Hb9-/+C9orf72+/+ and Hb9-/+C9orf72-/- larvae. To account for size differences, mean VRD was normalized to the mean hemisegment length (MHL) of the five PMN considered for each specimen (N = 20, n = 100). (F, G) Quantitative analysis of axonal branching showed a mild but significant increase in the mean number of branches per 1 mm of axonal filament (F) and a significant increase in mean total traced axonal filament length (G) in Hb9-/+C9orf72-/- larvae compared to controls. Two PMNs were traced per specimen per genotype (N = 9-10, n = 18-20). Statistical tests: Mann-Whitney test (D); unpaired two-tailed parametric t-test (E–G). ** p ≤ 0.01, * p ≤ 0.05, NS p > 0.05. Boxplot representation: Extremities indicate minimum and maximum values; box limits represent the interquartile range (central 50%), and the central line marks the median. N represents the number of distinct specimens; n represents the total number of PMN units per genotype analyzed. Scale bars = 30 µm.

Figure Data
Acknowledgments
This image is the copyrighted work of the attributed author or publisher, and ZFIN has permission only to display this image to its users. Additional permissions should be obtained from the applicable author or publisher of the image. Full text @ PLoS One