IMAGE

Fig 3

ID
ZDB-IMAGE-260413-50
Publication
Emond et al., 2026 - Characterization of a C9orf72 Knockout Danio rerio model for ALS and cross-species validation of potential therapeutics screened in Caenorhabditis elegans
All Figures
Figures for Emond et al., 2026
Image
Figure Caption

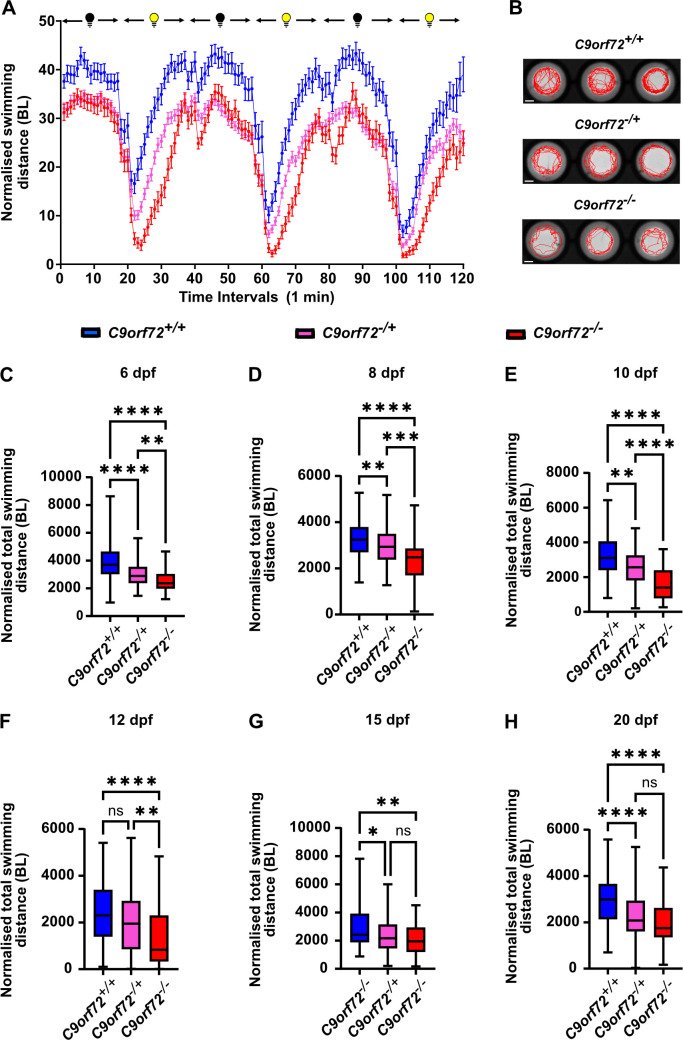
Fig 3 The knockout of C9orf72 leads to a sustained decrease in swimming activity in larvae.

(A) Typical swimming distance normalized by mean body length (BL) per minute pattern observed during a 120-minute alternating dark-light paradigm, consisting of 20-minute periods, for C9orf72+/+, C9orf72-/+, and C9orf72-/- 6 days post-fertilization (dpf) larvae. Data are presented as mean  ±  SEM. (B) Representative 60-second swimming tracks of C9orf72+/+, C9orf72-/+, and C9orf72-/- 6 dpf zebrafish larvae subjected to the phasic program. (C-H) Quantitative analysis of total swimming distance normalized by corresponding genotype mean BL at 6, 8, 10, 12, 15, and 20 dpf after 120 minutes of exposure to our phasic program. (C-E) A significant deficit in swimming activity is observed for C9orf72-/+ and C9orf72-/- compared to C9orf72+/+ controls, and for C9orf72-/- compared to C9orf72-/+ specimens at 6, 8, and 10 dpf. (F)C9orf72-/- specimens show a significant deficit in normalized swimming activity compared to C9orf72+/+ and C9orf72-/+ larvae at 12 dpf. (G-H)C9orf72-/- and C9orf72-/+ specimens exhibit a significant reduction in normalized swimming activity compared to C9orf72+/+ controls at 15 and 20 dpf. Statistical tests: Kruskal-Wallis test with Dunn#39;s multiple comparisons post-hoc test (C, E, F, G, H), Brown-Forsythe ANOVA with Dunnett#39;s T3 multiple comparisons post-hoc test (D). **** p  <  0.0001, ** p ≤ 0.01, * p ≤ 0.05, and NS p > 0.05. Boxplot extremities indicate maximum and minimum values, while box limits represent the range of the central 50% of the data, and the central line marks the median value. N = 3, n = 72 for each genotype except for C9orf72-/+, where n = 144. N represents the number of experimental repeats from different clutches, and n signifies the total number of larvae per genotype considered for the assay. Scale bars  =  0.2 cm.

Figure Data
Acknowledgments
This image is the copyrighted work of the attributed author or publisher, and ZFIN has permission only to display this image to its users. Additional permissions should be obtained from the applicable author or publisher of the image. Full text @ PLoS One