IMAGE

Figure 4

ID
ZDB-IMAGE-260313-15
Genes
Publication
Tarahomi et al., 2025 - Transcriptomic identification and developmental mapping of nrg3b expression in zebrafish
All Figures
Figures for Tarahomi et al., 2025
Image
Figure Caption

Figure 4

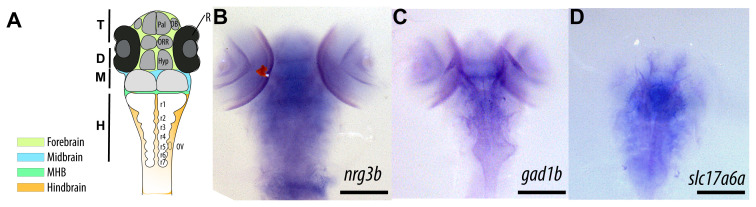
Comparative analysis of nrg3b expression with glutamatergic and GABAergic markers in the 5 dpf zebrafish. A, A schematic overview of the coronal zebrafish embryonic brain. The illustration is not drawn to scale. Distinct color codes highlight the principal brain regions: the forebrain (yellow), midbrain (blue), midbrain–hindbrain boundary (green), and hindbrain (orange). The forebrain further differentiates into the telencephalon (T, darker gray) and diencephalon (D, lighter gray), the latter encompassing the hypothalamic domain. T, telencephalon; D, diencephalon; M, midbrain; MHB, midbrain–hindbrain boundary; H, hindbrain; Hyp, hypothalamus; OB, olfactory bulb; ORR, optic recess region; OV, otic vesicle; Pal, pallium; R, retina; r1–r7, rhombomeres 1–7. Scale bars: 100 μm. Adapted conceptually from (Vaz et al. 2019). B, ISH for nrg3b at 5 dpf (dorsal view) shows a strong signal in the anterior forebrain and dorsal midbrain, extending slightly along the neural tube. A red signal detected in the retinal area corresponds to a staining artifact. C, ISH for gad1b (a marker of GABAergic neurons) shows a widespread expression pattern in the ventral forebrain, midbrain, and hindbrain, with the highest staining intensity in the optic tectum and ventral regions. D, ISH for slc17a6a (a marker of glutamatergic neurons) highlights areas of the forebrain and dorsal midbrain that partially overlap with the expression pattern of nrg3b. Scale bars: 100 μm.

Figure Data
Acknowledgments
This image is the copyrighted work of the attributed author or publisher, and ZFIN has permission only to display this image to its users. Additional permissions should be obtained from the applicable author or publisher of the image. Full text @ Turk J Biol