Figure Caption
Fig. 5
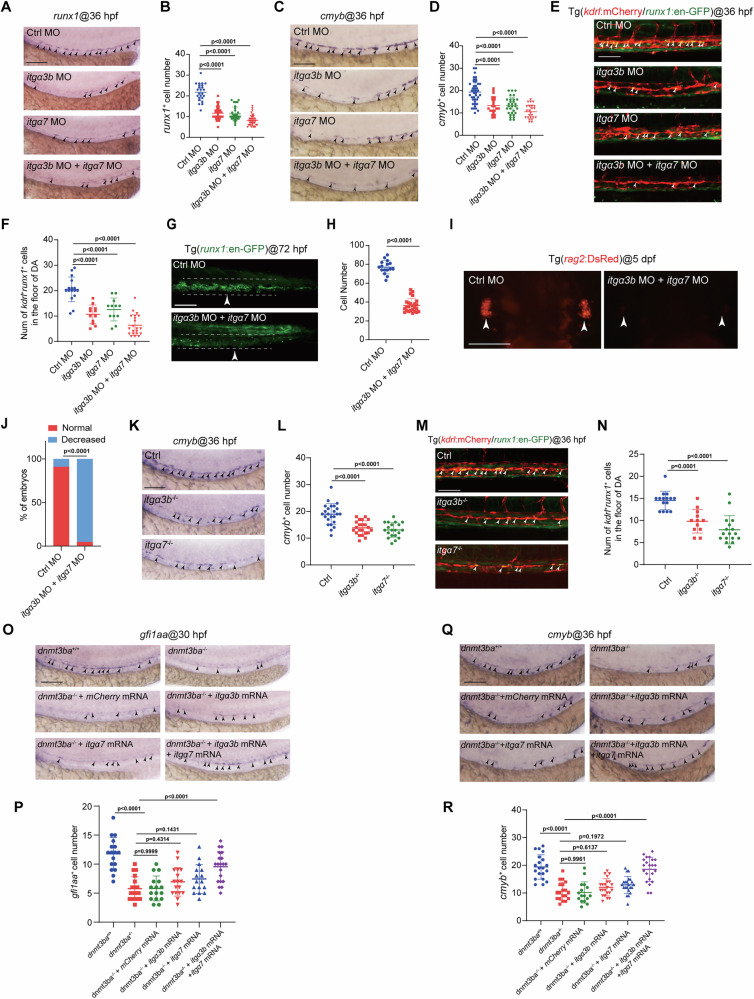
HSPC development is impaired in itgα3b/itgα7-deficient embryos.
A WISH showing the expression of HSPC marker runx1 (arrowheads) in the VDA region of control, itgα3b morphants, itgα7 morphants, and itgα3b+itgα7 morphants at 36 hpf. Three independent experiments were conducted. B Quantification of runx1+ cells (n = 24 (ctrl), 36 (itgα3b MO), 35 (itgα7 MO), 41 (itgα3b MO+itgα7 MO) embryos). C WISH showing the expression of HSPC marker cmyb (arrowheads) in the VDA region of control, itgα3b morphants, itgα7 morphants, and itgα3b+itgα7 morphants at 36 hpf. Three independent experiments were conducted. D Quantification of cmyb+ cells (n = 42 (ctrl), 22 (itgα3b MO), 30 (itgα7 MO), 24 (itgα3b MO+itgα7 MO) embryos). Confocal imaging shows the kdrl+runx1+ HECs (white arrowheads) in the VDA region of control, itgα3b morphants, itgα7 morphants, and itgα3b+itgα7 morphants with Tg(kdrl:mCherry/runx1:en-GFP) background at 36 hpf (E), and quantification of the number of kdrl+runx1+ HECs (n = 16 (ctrl), 12 (itgα3b MO), 12 (itgα7 MO), 21 (itgα3b MO+itgα7 MO) embryos) in (F). Three independent experiments were conducted. Confocal imaging shows runx1+ HSPCs (white arrowheads) in the CHT region of control and itgα3b+itgα7 morphants with Tg(runx1:en-GFP) background at 72 hpf (G), and quantification of runx1+ cells in CHT (n = 16 (ctrl), 25 (itgα3b MO+itgα7 MO) embryos) in (H). Three independent experiments were conducted. I, J Confocal imaging shows rag2+ lymphocytes (white arrowheads) in the thymus of control and itgα3b+itgα7 morphants with Tg(rag2:DsRed) background at 5 dpf (I), and quantification of Tg(rag2:DsRed) embryos as indicated fluorescence intensity (n = 22 (ctrl), 21 (itgα3b MO+itgα7 MO)). Three independent experiments were conducted. K WISH showing the expression of HSPC marker cmyb (arrowheads) in the VDA region of control, itgα3b mutants, and itgα7 mutants at 36 hpf. Three independent experiments were conducted. L Quantification of cmyb+ cells (n = 24 (ctrl), 22 (itgα3b−/−), 20 (itgα7−/−) embryos). M Confocal imaging shows the kdrl+runx1+ HECs (white arrowheads) at 36 hpf in the VDA region of control, itgα3b mutants, and itgα7 mutants with Tg(kdrl:mCherry/runx1:en-GFP) background. Three independent experiments were conducted. N Quantification of the number of kdrl+runx1+ HECs (n = 15 (ctrl), 12 (itgα3b−/−), 17 (itgα7−/−) embryos). O WISH showing the expression of HEC marker gfi1aa (arrowheads) at 36 hpf in WT, dnmt3ba mutants, dnmt3ba mutants injected with mCherry mRNA, dnmt3ba mutants injected with itgα3b mRNA, dnmt3ba mutants injected with itgα7 mRNA, and dnmt3ba mutants injected with itgα3b+itgα7 mRNA. P Quantification of gfi1aa+ cells (n = 17 (dnmt3ba+/+), 18 (dnmt3ba−/−), 16 (dnmt3ba−/−+mCherry), 17 (dnmt3ba−/−+itgα3b), 16 (dnmt3ba−/−+itgα7), 20 (dnmt3ba−/−+itgα3b+itgα7) embryos at 30 hpf). Q WISH showing the expression of HSPC marker cmyb (arrowheads) at 36 hpf in WT, dnmt3ba mutants, dnmt3ba mutants injected with mCherry mRNA, dnmt3ba mutants injected with itgα3b mRNA, dnmt3ba mutants injected with itgα7 mRNA, and dnmt3ba mutants injected with itgα3b+itgα7 mRNA. Three independent experiments were conducted. R Quantification of cmyb+ cells (n = 20 (dnmt3ba+/+), 19 (dnmt3ba−/−), 16 (dnmt3ba−/−+mCherry), 22 (dnmt3ba−/−+itgα3b), 22 (dnmt3ba−/−+itgα7), 22 (dnmt3ba−/−+itgα3b+itgα7) embryos). Scale bars, 100 µm. Statistical significance was determined by a Two-tailed Student’s t-test in (H), One-way ANOVA in (B, D, F, L, N, P, R), and a Two-tailed Fisher’s exact test in (J), respectively. Data are presented as mean ± SD.
Acknowledgments
This image is the copyrighted work of the attributed author or publisher, and
ZFIN has permission only to display this image to its users.
Additional permissions should be obtained from the applicable author or publisher of the image.
Full text @ Commun Biol