IMAGE

Fig. 2

ID
ZDB-IMAGE-251121-10
Source
Figures for Ai et al., 2025
Image
Figure Caption

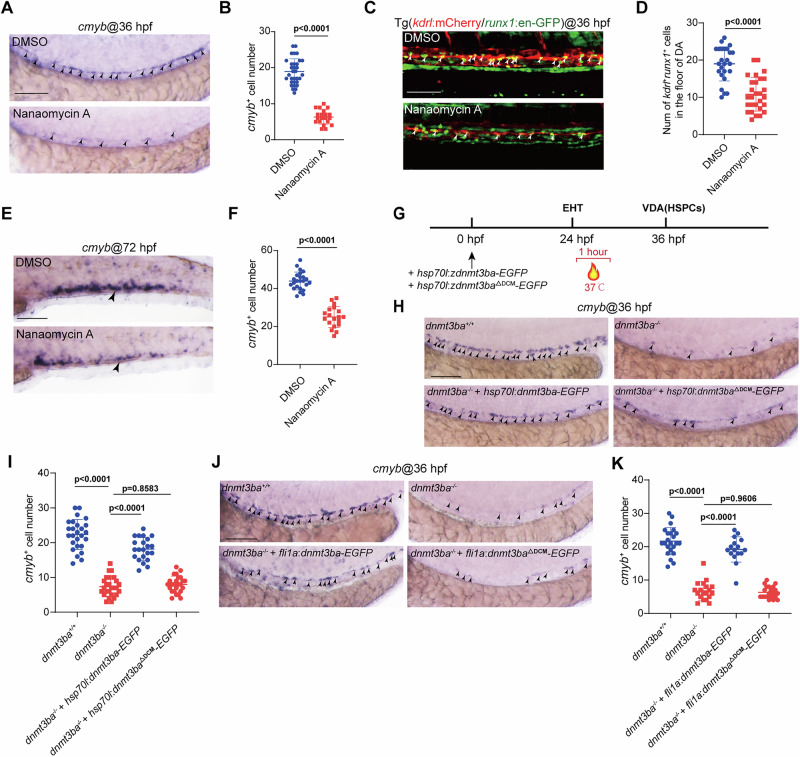
Fig. 2 The DNA methyltransferase activity of Dnmt3ba is required for HSPC development.

A WISH at 36 hpf showing the embryos treated with Nanaomycin A at 24 hpf impaired the expression of HSPC marker cmyb (arrowheads) in the VDA region. Three independent experiments were conducted. B Quantification of cmyb+ cells (n = 32 (DMSO), 20 (Nanaomycin A) embryos). C Confocal imaging shows the kdrl+runx1+ HECs (white arrowheads) in the VDA region of DMSO or Nanaomycin A-treated embryos with Tg(kdrl:mCherry/runx1:en-GFP) background at 36 hpf. Three independent experiments were conducted. D Quantification of the number of kdrl+runx1+ HECs (n = 25 (DMSO), 28 (Nanaomycin A) embryos). E WISH showing the expression of HSPC marker cmyb (arrowheads) in the CHT region of DMSO or Nanaomycin A-treated embryos at 72 hpf. Three independent experiments were conducted. F Quantification of cmyb+ cells (n = 24 (DMSO), 19 (Nanaomycin A) embryos). G Schematic representation of heat-shock strategy to temporally and transiently express dnmt3ba or dnmt3ba△DCM at the beginning of EHT (24–32 hpf). H WISH showing the expression of cmyb (arrowheads) at 36 hpf in WT, dnmt3ba mutants, and dnmt3ba mutants injected with hsp70l:dnmt3ba-EGFP or hsp70l:dnmt3ba△DCM-EGFP construct, respectively. Three independent experiments were conducted. I Quantification of cmyb+ cells (n = 26 (dnmt3ba+/+), 26 (dnmt3ba/), 22 (dnmt3ba/+hsp70l:dnmt3ba), 25 (dnmt3ba/+hsp70l:dnmt3ba△DCM) embryos). J WISH showing the expression of cmyb (arrowheads) at 36 hpf in WT, dnmt3ba mutants, and dnmt3ba mutants injected with fli1a:dnmt3ba-EGFP or fli1a:dnmt3ba△DCM-EGFP construct, respectively. Three independent experiments were conducted. K Quantification of cmyb+ cells (n = 23 (dnmt3ba+/+), 19 (dnmt3ba/), 16 (dnmt3ba/+fli1a:dnmt3ba), 21 (dnmt3ba/+fli1a:dnmt3ba△DCM) embryos). Scale bars, 100 µm. Statistical significance was determined by a Two-tailed Student’s t-test in (B, D, F) and a One-way ANOVA in (I, K), respectively. Data are presented as mean ± SD.

Acknowledgments
This image is the copyrighted work of the attributed author or publisher, and ZFIN has permission only to display this image to its users. Additional permissions should be obtained from the applicable author or publisher of the image. Full text @ Commun Biol