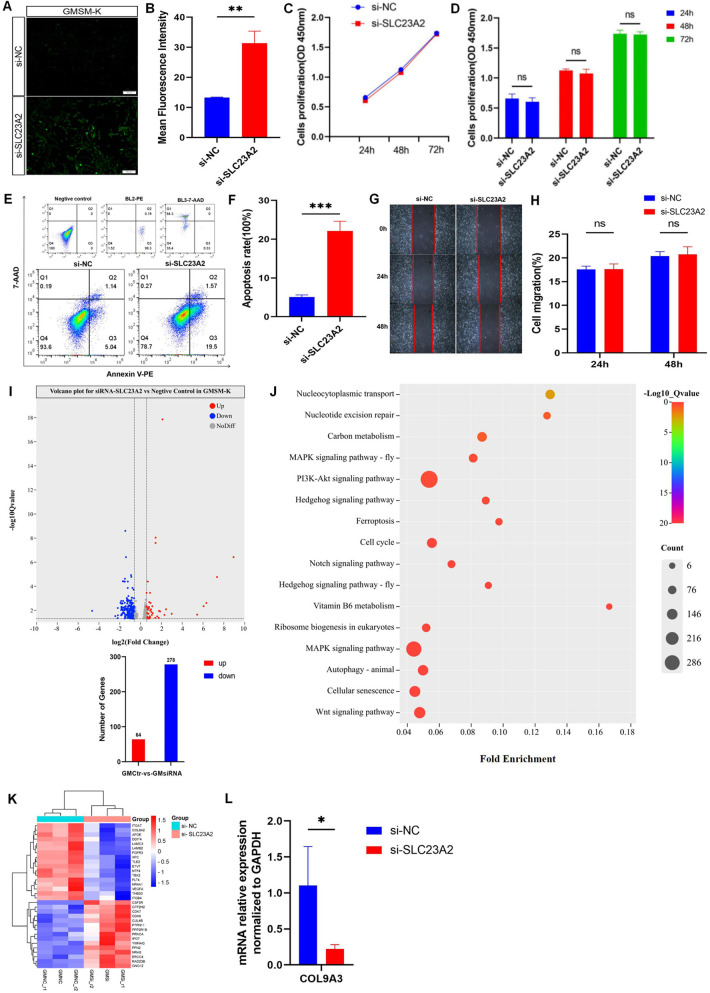
Changes in cell biology and ROS level in GMSM-K cells after SLC23A2 knockdown. (A,B) ROS levels after knockdown of SLC23A2. (C,D) Cell proliferation after knockdown of SLC23A2. (E,F) Cell apoptosis after knockdown of SLC23A2. (G,H) Change in cell migration after SLC23A2 knockdown. (I) Volcano plot for differential gene expression. (J) KEGG enrichment analysis of DEGs. (K). The heat map of all DEGs, with genes related to cell proliferation, cell apoptosis, and cell cycle regulation given particular attention. (L) RT-qPCR verification result for the DEGs. Error bars represent SD. n = 3; ns, P > 0.05; **, P < 0.01; ***, P < 0.001.
Acknowledgments
This image is the copyrighted work of the attributed author or publisher, and
ZFIN has permission only to display this image to its users.
Additional permissions should be obtained from the applicable author or publisher of the image.
Full text @ Front Pediatr
Your Input Welcome
Thank you for submitting comments. Your input has been emailed to ZFIN curators who may contact you if
additional information is required.
Oops. Something went wrong. Please try again later.