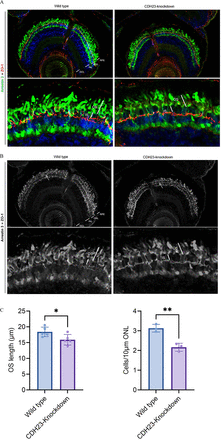
Fig. 5 (A) Compared with wild zebrafish, CDH23-knockdown zebrafish photoreceptors are more sparse, but photoreceptors are more closely connected to each other. Up: Scale bars: 10 mm. Down: Scale bars: 2 mm. (B) Grayscale version of panel A; arrows indicate the connecting structures between the photoreceptors. (C) Effects of CDH23 knockdown on OS length and ONL cell density in zebrafish retinas. Bar graphs present mean OS length (μm) and ONL cell counts (cells/10 µm ONL) for wild type and CDH23- knockdown groups. Sample sizes: n=5 for OS length and n=3 for ONL cell density. Data are expressed as mean±SEM; *p<0.05, **p<0.01 (independent-samples t-test) (Representative images shown). GCL, ganglion cell layer; INL, inner nuclear layer; IS, inner segment; ONL, outer nuclear layer; OS, outer segment; RPE, retinal pigment epithelium.
Image
Figure Caption
Acknowledgments
This image is the copyrighted work of the attributed author or publisher, and
ZFIN has permission only to display this image to its users.
Additional permissions should be obtained from the applicable author or publisher of the image.
Full text @ BMJ Open Ophthalmol

