
|
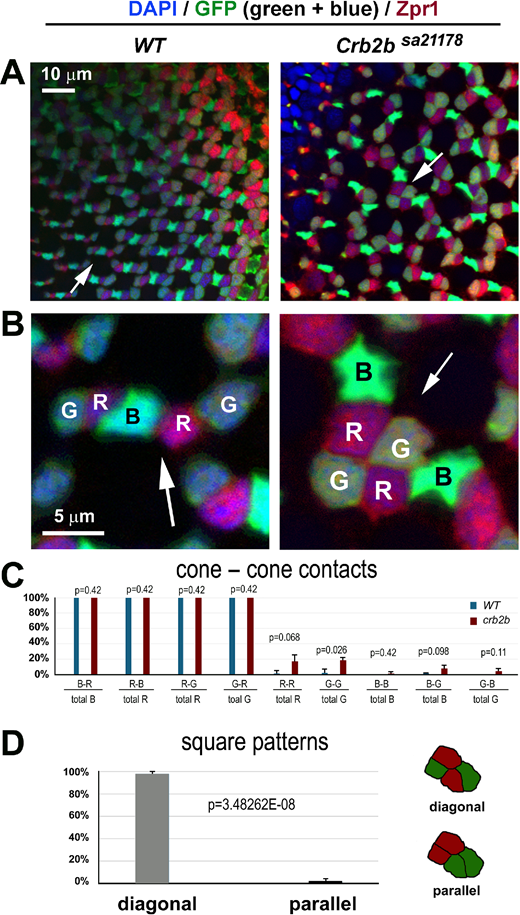
Fig. 4 Cones of the same type are positioned diagonally in the red/green cone squares. (A, B) With GFP expression (green) in the green and blue cones of the pt112 transgenic background20 and Zpr1 antibody reactivity (red) in red and green cones, RGB cones can be distinguished unequivocally in the wild-type and crb2bsa21178 homozygous mutants. B shows magnifications of local regions of A (arrows). DAPI staining is blue (at 6 mpf). (C) The preferred cone–cone adhesions are reflected by the percentages of cone types that adhered to themselves or to other types of cones. For example, “R–B/total R” means the percentage of red cones that adhered to one or more blue cones. (D) The distribution of red and green cones in squares in diagonal or parallel patterns, depicted on the right (n = 4 fish for each genotype; one confocal image per fish). P values were calculated with Student's t-test.