
|
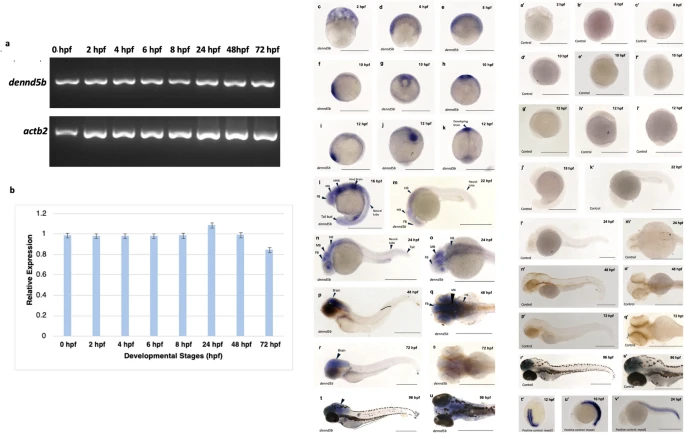
Fig. 2 Temporal and spatial expression of dennd5b during zebrafish embryogenesis. a-b Semi-quantitative RT-PCR analysis of dennd5b expression at 0, 2, 4, 6, 8, 24, 48, and 72 hpf developmental stages. Zebrafish actb2 was used as an internal control for normalization. b Densitometry-based quantification of dennd5b expression levels relative to actb2. Data are normalized to the 24 hpf timepoint and expressed as mean ± SEM from n = 3 replicates. c- v′ Whole-mount in situ hybridization showing dennd5b mRNA expression at various developmental stages. c-e Early development (2–8 hpf). f-h 10 hpf. i-k 7–8 somite stage (12 hpf), expression in developing brain region. l 16 hpf, expression in brain regions including forebrain (FB), midbrain (MB), hindbrain (HB), and developing neural tube and tail bud. m 22 hpf, expression in FB, MB, HB and neural tube. n-o 24 hpf, strong expression in brain regions (HB, MB, FB) with developing neural tube and tail. p-q 48 hpf, prominent brain expression with developing body structures. r-s 72 hpf, continued brain expression in developing larva. t-u 96 hpf, expression maintained in brain regions of free-swimming larva. In situ hybridization of dennd5b with sense probe, which shows no staining. a′ 2 hpf, b′ 6 hpf, c′ 8 hpf, d′-f′ 10 hpf, g′-i′ 12 hpf, j′ 16 hpf, k′ 22 hpf, l′-m′ 24 hpf, n′-o′ 48 hpf, p′-q′ 72 hpf, r′-s′ 96 hpf. t′-v′ Expression of positive control gene myod1 in the somite at 12 hpf, 16 hpf and 24 hpf, respectively. Scale bar 500 μm