
|
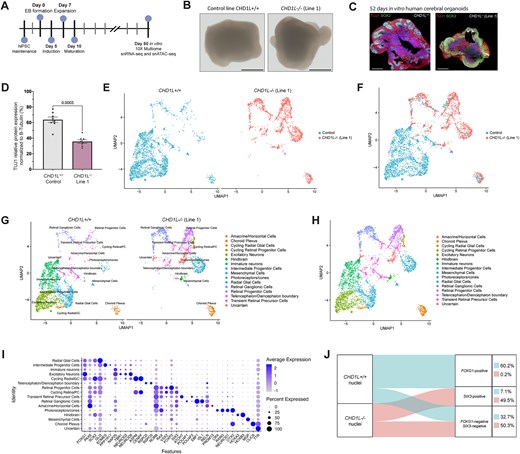
Fig. 7 Loss of CHD1L perturbs forebrain cell-fate determination in hCO. (A) Schematic of hCO generation from hiPSC. (B) Pictures of 60 DIV hCO derived from CHD1L+/+ and the two CHD1L−/− cell lines. Scale bars: 1 mm. (C) Immunostaining against TUJ1 (neuronal cytoskeleton marker) and SOX2 (neural progenitor cells) on 52 DIV hCO either CHD1L−/− (Mutant Line 1) or control. Scale bars: 500 μm. (D) Semi-quantitative analysis of TUJ1 protein expression in CHD1L−/− (Mutant Line 1) and control hCO normalized with β-Tubulin. Data shown as mean ± SEM of 8 hCO per condition; representative of N = 2 batches of generated organoids; Student’s t-test. (E) Uniform Manifold Approximation and Projection (UMAP) projection of CHD1L+/+ and CHD1L−/- hCO cells colored by condition. N = 6 organoids per condition, 2385 cells CHD1L+/+ and 1634 cells CHD1L−/− sequenced. (F) UMAP representation of CHD1L+/+ and CHD1L−/− (Mutant Line 1) multiome analysis combined and integrated on the same graph. N = 12 organoids, 4019 cells. (G) UMAP representation of CHD1L+/+ and CHD1L−/− (Mutant Line 1) hCO multiome analysis on the same graph. Clusters based on cell identities are indicated. (H) UMAP representation of CHD1L+/+ and CHD1L−/− (Mutant Line 1) hCO multiome analysis combined and integrated on the same graph. Clusters based on cell identities are indicated. (I) Dot plot representing key cell type markers and their levels of gene expression within cerebral organoids’ cell clusters. Dot size indicates the proportion of cells per cluster expressing the corresponding gene and color is associated to the average expression level of the corresponding gene per cluster. (J) Sankey diagram visualization of the proportion of nuclei positive for either the ventral telencephalic marker FOXG1, or the eye territory marker SIX3 (normalized expression >1) in CHD1L+/+ and CHD1L−/− hCO. Percentage of nuclei is indicated for each category.