
|
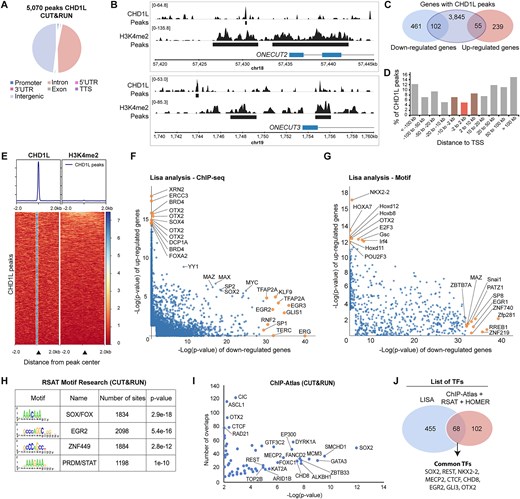
Fig. 5 Characterization of CHD1L binding in hNPC. (A) Pie chart of the genomic distribution of CHD1L CUT&RUN peaks in control hNPC. (B) Examples of CHD1L-bound sites located upstream of downregulated genes ONECUT2 and ONECUT3. (C) Venn diagram showing CHD1L-bound genes that are downregulated or upregulated in CHD1L mutant hNPC. (D) CHD1L Peak distribution from TSS. (E) Tag density map of CHD1L and H3K4me2 CUT&RUN peaks, ± 2 kb from the CHD1L peak center and corresponding average tag density profiles. (F, G) Lisa results showed as pairwise scatterplots for comparison of the two gene sets (downregulated and upregulated genes in absence of CHD1L in hNPC) based on TF ChIP-seq and TF motifs respectively. The top 10 TFs are shown in yellow. (H, I) RSAT-based motif enrichment analysis and ChIP-Atlas comparison of CHD1L CUT&RUN data, respectively. (J) Venn diagram showing common TFs predicted by Lisa, ChIP-Atlas, RSAT, and HOMER analyses.