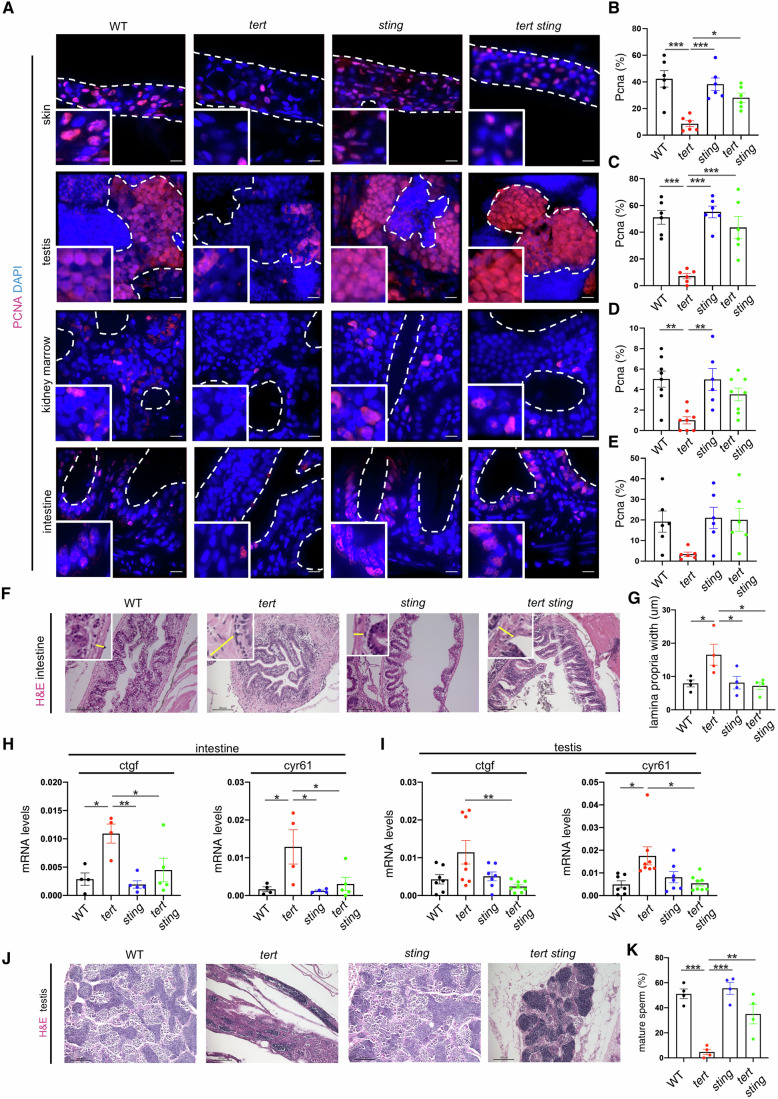
Figure Caption
Figure 5
cGAS-STING pathway control proliferation in telomeric dysfunction.
(A) Representative immunofluorescence images of proliferation and apoptosis. Scale bar = 10 µm. (B) Quantification of proliferation in the skin (nWT = 5, ntert-/- = 6, nsting-/- = 6, ntert-/- sting-/- = 6 WT vs tert-/- p = 0.0001, sting-/- vs tert-/- p = 0.0006, tert-/- vs tert-/- sting-/- p = 0.024). (C) Quantification of proliferation in the testis (nWT = 6, ntert-/- = 6, nsting-/- = 6, ntert-/- sting-/- = 6, WT vs tert-/- p = 0.00007, sting-/- vs tert-/- p = 0.00002, tert-/- vs tert-/- sting-/- p = 0.0006). (D) Quantification of proliferation in the kidney marrow (nWT = 8, ntert-/- = 8, nsting-/- = 6, ntert-/- sting-/- = 8, WT vs tert-/- p = 0.002, sting-/- vs tert-/- p = 0.004). (E) Quantification of proliferation in the intestine (nWT = 6, ntert-/- = 5, nsting-/- = 6, ntert-/- sting-/- = 8). (F) Representative hematoxylin eosin staining of intestine, insets with yellow lines representative of lamina propria thickness. Scale bar = 100 µm. (G) Quantification of lamina propria width (nWT = 4, ntert-/- = 4, nsting-/- = 4, ntert-/- sting-/- = 4, WT vs tert-/- p = 0.042, sting-/- vs tert-/- p = 0.048). (H) RT-qPCR analysis of YAP-TAZ pathway targets in the intestine (nWT = 4, ntert-/- = 4, nsting-/- = 5, ntert-/- sting-/- = 5, ctfg: WT vs tert-/- p = 0.016 sting-/- vs tert-/- p = 0.005, tert-/- vs tert-/- sting-/- p = 0.044; cyr61: WT vs tert-/- p = 0.030, sting-/- vs tert-/- p = 0,023, tert-/- vs tert-/- sting-/- p = 0.046). (I), RT-qPCR analysis of YAP-TAZ pathway targets in the testis (nWT = 7, ntert-/- = 8, nsting-/- = 6–7, tert-/- sting-/- = 7–8, cftg: tert-/- vs tert-/- sting-/- p = 0.008, cyr61: tert-/- vs tert-/- sting-/- p = 0.011). (J) Representative hematoxylin eosin staining of testis. Scale bar = 100 µm. (K) Quantification of mature sperm area (nWT = 4, ntert-/- = 4, nsting-/- = 4, ntert-/- sting-/- = 4, WT vs tert-/- p = 0.0002, sting-/- vs tert-/- p = 0.00007, tert-/- vs tert-/- sting-/- p = 0.006). All data were presented as the mean ± s.e.m.; *p < 0.05; **p < 0.01, ***p < 0.001, using a one-way ANOVA and post hoc Tukey test. Source data are available online for this figure.
Acknowledgments
This image is the copyrighted work of the attributed author or publisher, and
ZFIN has permission only to display this image to its users.
Additional permissions should be obtained from the applicable author or publisher of the image.
Full text @ EMBO J.