
|
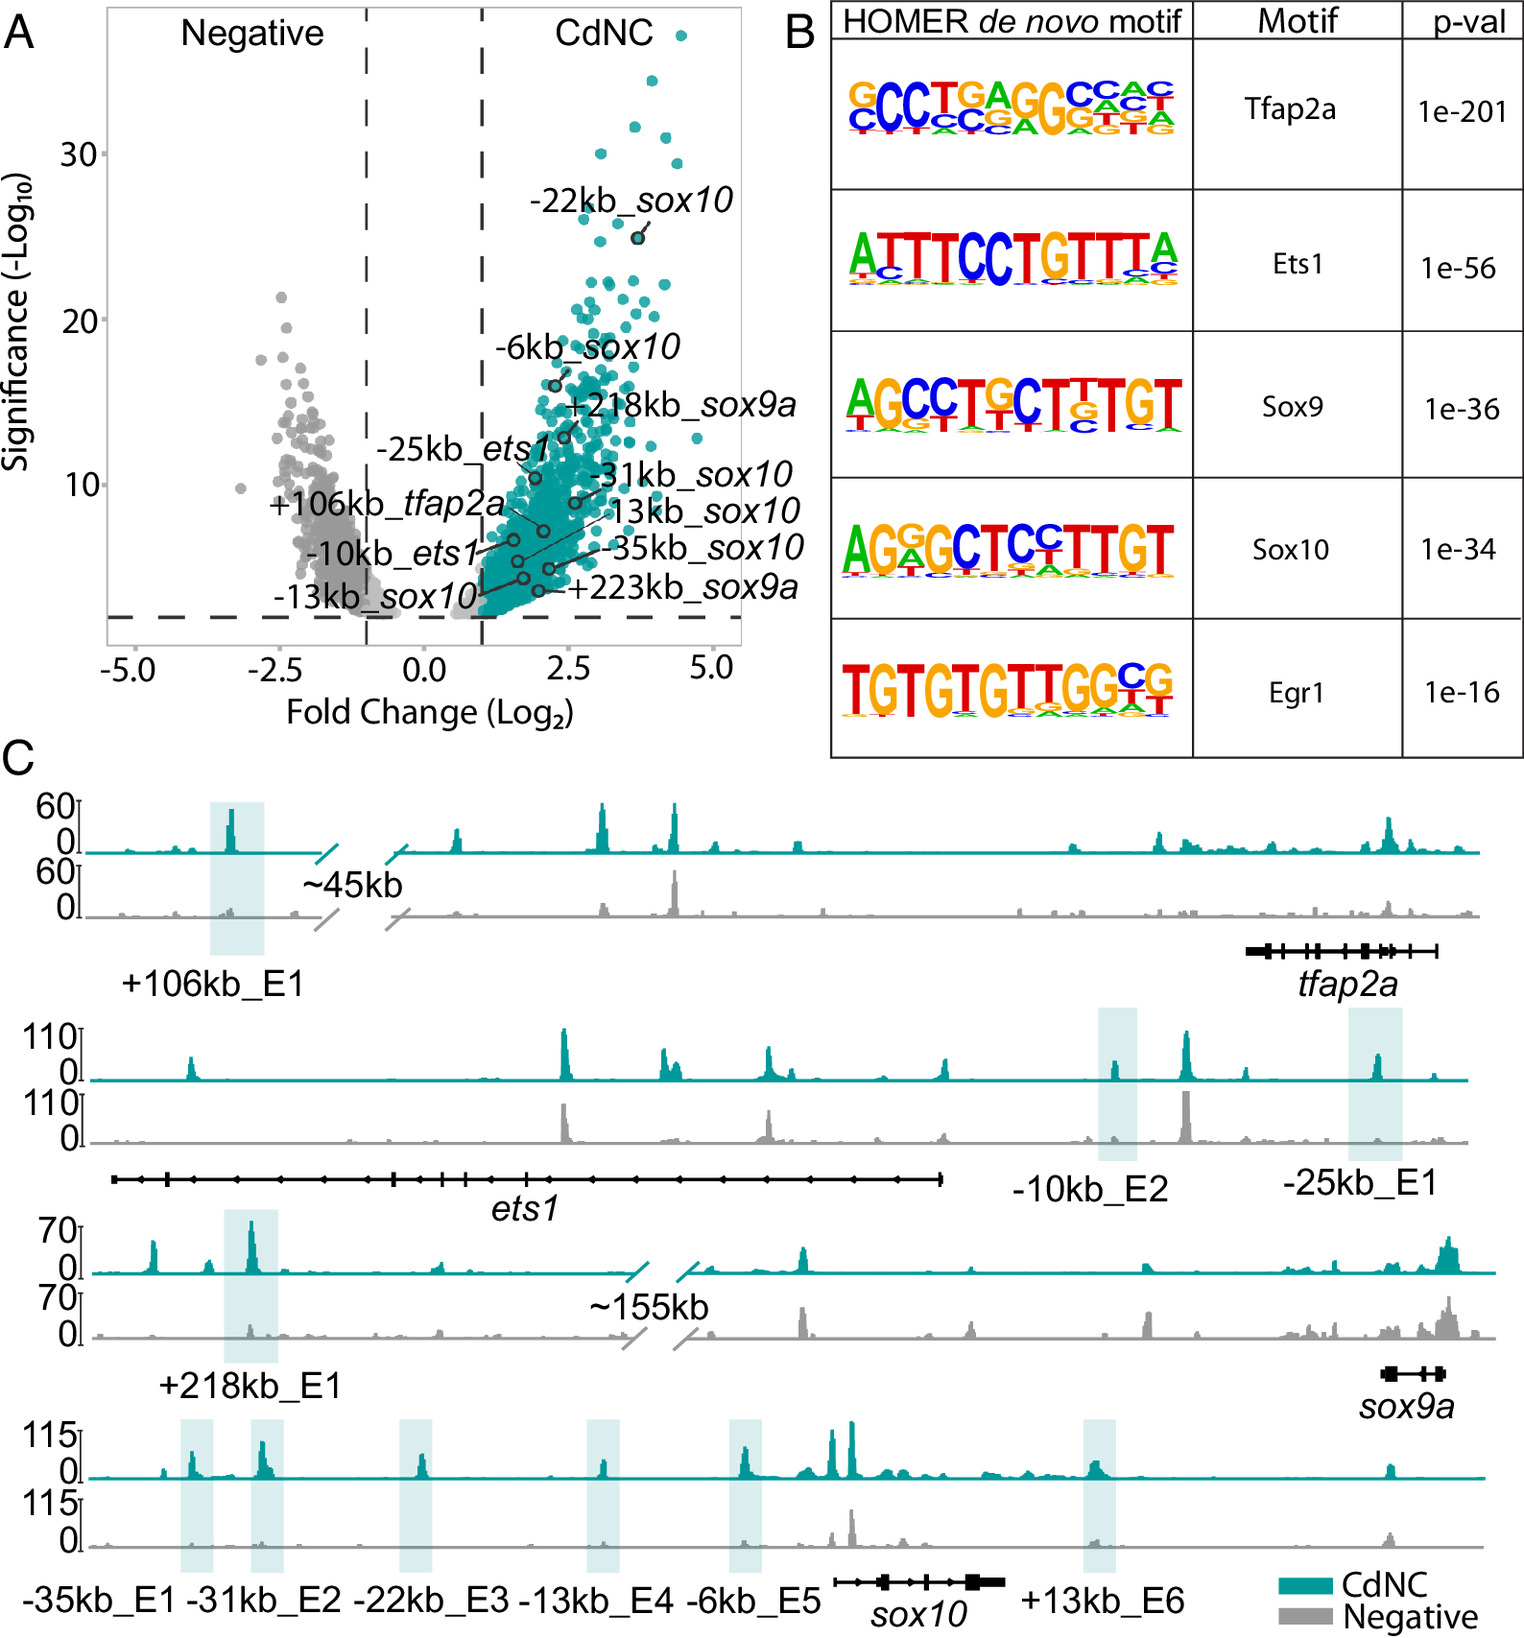
Fig. 2 ATAC-seq and differential chromatin accessibility and transcription factor motif analysis uncovers putative enhancers and transcriptional regulators unique to the CdNC. (A) Volcano plot of merged peaks of sorted bulkATAC-seq shows differentially accessible regions in CdNC (mCherry+) and non-NC/negative cells (mCherry-). (B) Results of HOMER de novo motif analysis showing motif, transcription factor, and associated P-value. (C) IGV genome browser tracks of the ets1, tfap2a, sox9a, and sox10 loci. Highlighted peaks represent putative enhancer regions called by Diffbind (turquoise track = CdNC, gray track = negative).