
|
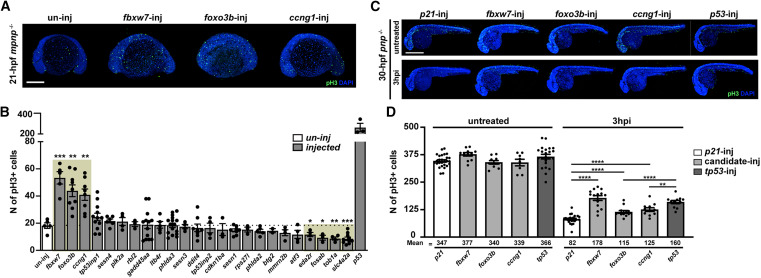
Fig. 7 fbxw7, foxo3b and ccng1 G0 crispants mitigate p53-mediated cell-cycle arrest (A) Representative images showing pH3-stained un-injected (control, un-inj) and injected mpnp−/− embryos at 21 hpf. Scale bar: 250μM. (B) Quantification of pH3 positive cells in injected mpnp−/− embryos for 24 GOIs. un-inj (negative control) and the p53 guides-injected (p53, positive control). (C) Representative images representing pH3-stained, IR-irradiation treated or untreated, four-guide injected pnp−/− embryos at 30 hpf. Scale bar: 500μM. (D) Quantification of pH3 positive cells in injected pnp−/− embryos for fbxw7, foxo3b and ccng1. p21-inj (negative control) and p53-inj (positive control). Each dot represents an individual. Bars represent mean ± SEM. ∗, p < 0.05. ∗∗, p < 0.01.∗∗∗, p < 0.001.∗∗∗∗, p < 0.0001.