
|
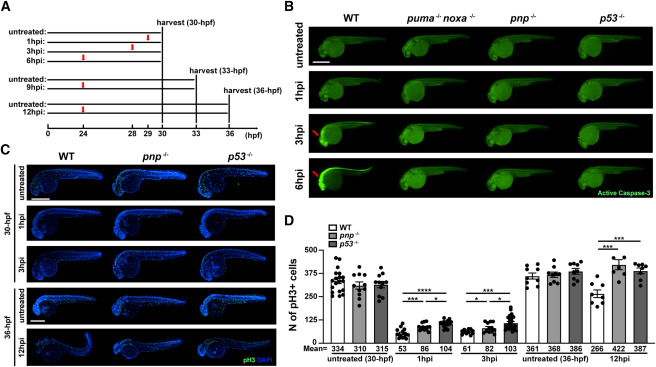
Fig. 2 Loss of puma, noxa, and p21 provide resistance to p53-mediated induction of apoptosis and partially resistance to p53-mediated cell-cycle arrest (A) Experimental workflow showing how samples were harvested. 29-, 27- and 24-h post fertilization (hpf) wildtype, puma−/−; noxa−/−, pnp−/− and p53−/− zebrafish embryos were treated with 30 Gy IR-irradiation and fixed at 1-, 3-, 6-, 9- and 12-h post IR-treatment (hpi, 1hpi, 3hpi and 6hpi panels). (B) Representative images of anti-active Caspase-3 staining on 30-hpf zebrafish embryos for each group. Arrows in WT points out active apoptotic area in head region at 3 and 6 hpi. Scale bar: 500μM. (C) Representative images of phospho-histone H3 (pH3)-stained 30-hpf (1 and 3 hpi) or 36-hpf (12 hpi) zebrafish embryos for each group. Experimental design showing in Figures 2A and S2A. Scale bar: 500μM. (D) Quantification of pH3 positive cells in treated and untreated WT, pnp−/− and p53−/− embryos for each group. Each dot represents an individual. The average number of pH3+ cells (Mean) were indicated in each group. Bars represent mean ± SEM. ∗, p < 0.05. ∗∗∗, p < 0.001.∗∗∗∗, p < 0.0001.