
|
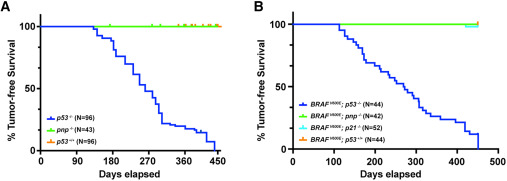
Fig. 1 puma−/−; noxa−/−; p21−/− zebrafish are not predisposed to spontaneous tumors (A) Kaplan-Meier tumor-free survival of p53−/− (blue curve, N = 96, T50 = 261 days) zebrafish compared with puma−/−; noxa−/−; p21−/− (called pnp−/−, N = 43, green) and wildtype allele (N = 96, orange). (B) Kaplan-Meier tumor-free survival of BRAFV600E; p53−/− (blue curve, N = 44, T50 = 271 days) zebrafish compared with BRAFV600E; puma−/−; noxa−/−; p21−/− (called BRAFV600E; pnp−/−, N = 42, green), BRAFV600E; p21−/− (N = 52, green), and wildtype allele (N = 44, orange). Long-rank statistic test was done. ∗∗∗∗, p-value between p53−/− and pnp−/− < 0.0001 and p-value between p53−/− and p53+/+ < 0.0001. ∗∗∗∗, p-value between BRAFV600E; p53−/− and BRAFV600E; pnp−/− < 0.0001, p-value between p-value between BRAFV600E; p53−/− and BRAFV600E; p21−/− < 0.0001, and BRAFV600E; p53−/− and BRAFV600E; p53+/+ < 0.0001.