
|
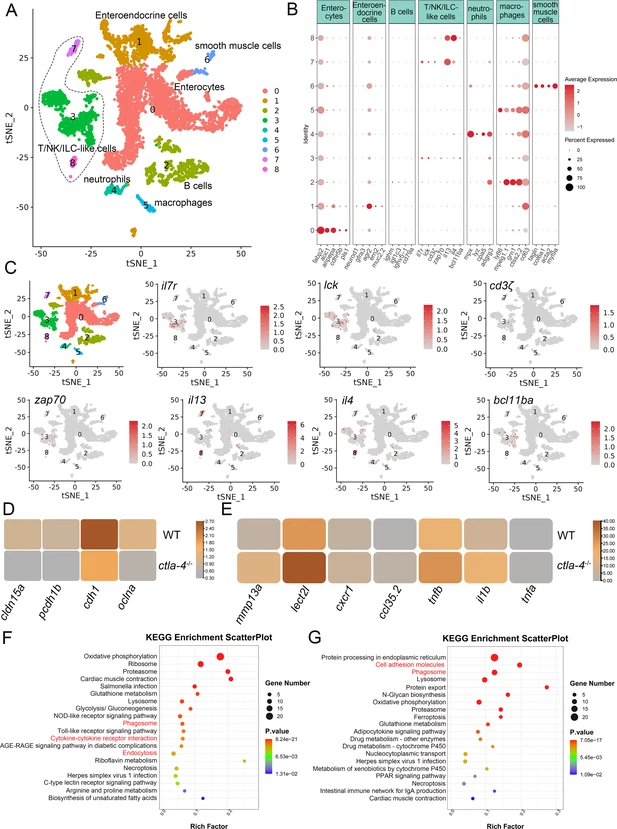
Fig. 4 Single-cell RNA sequencing analysis of the major cell types associated with the inflammatory bowel disease (IBD)-like phenotype in ctla-4-/- zebrafish. (A) Classification of cell types from zebrafish intestines by tSNE embedding. (B) Dot plot showing the expression levels of lineage marker genes and percentage of cells per cluster that express the gene of interest. (C) Expression maps of T cell-associated markers within the cell populations of the zebrafish intestines. (D) Heatmap showing the mean expression levels of genes associated with tight and adhesion junctions in enterocytes across samples from wild-type (WT) and ctla-4-/- zebrafish. (E) Heatmap showing the mean expression levels of inflammation-related genes involved in cytokine-cytokine receptor interactions in neutrophils from WT and ctla-4-/- zebrafish samples. (F) KEGG enrichment analysis showing the top 15 terms of up-regulated genes in neutrophils from the ctla-4-/- sample versus the WT sample. (G) KEGG enrichment analysis showing the top 15 terms of up-regulated genes in macrophages from the ctla-4-/- sample versus the WT sample.