
|
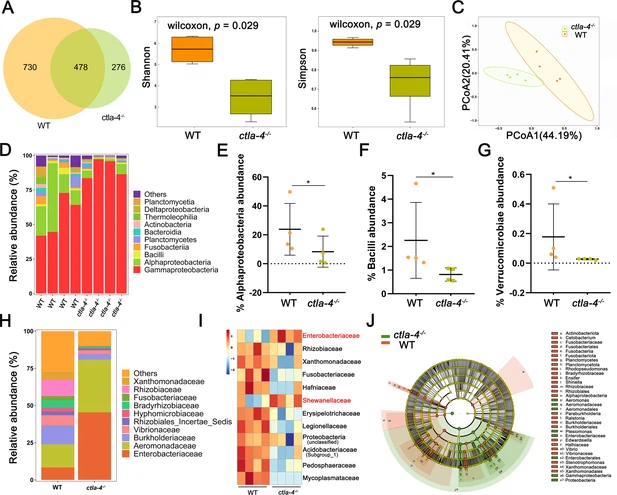
Fig. 6 Alteration in microbial composition in the intestines of ctla-4-/- zebrafish. (A) Venn diagram showing the number of amplicon sequence variants (ASVs) in zebrafish intestinal microbiota. (B) Alpha diversity of microbes was calculated through Shannon index and Simpson index. (C) Beta-diversity analyzed based on Principal Coordinate Analysis (PCoA) was shown by using Bray-Curtis distance. (D) The relative abundance of intestinal microbiota at the class level. (E–G) The relative abundance of Alphaproteobacteria (E), Bacilli (F), and verrucomicrobiae (G) in the intestines from the wild-type (WT) and ctla-4-/- zebrafish. *p < 0.05. (H) The relative abundance of intestinal microbiota at the family level. (I) Heatmap showing row-scaled expression of the differential abundances of bacterial communities at family level in the WT and ctla-4-/- zebrafish (p < 0.05). (J) Cladogram representation of LEfSe analysis showing the differentially abundant bacterial taxa between the intestines from WT (red) and ctla-4-/- (green) zebrafish (p < 0.05).