
|
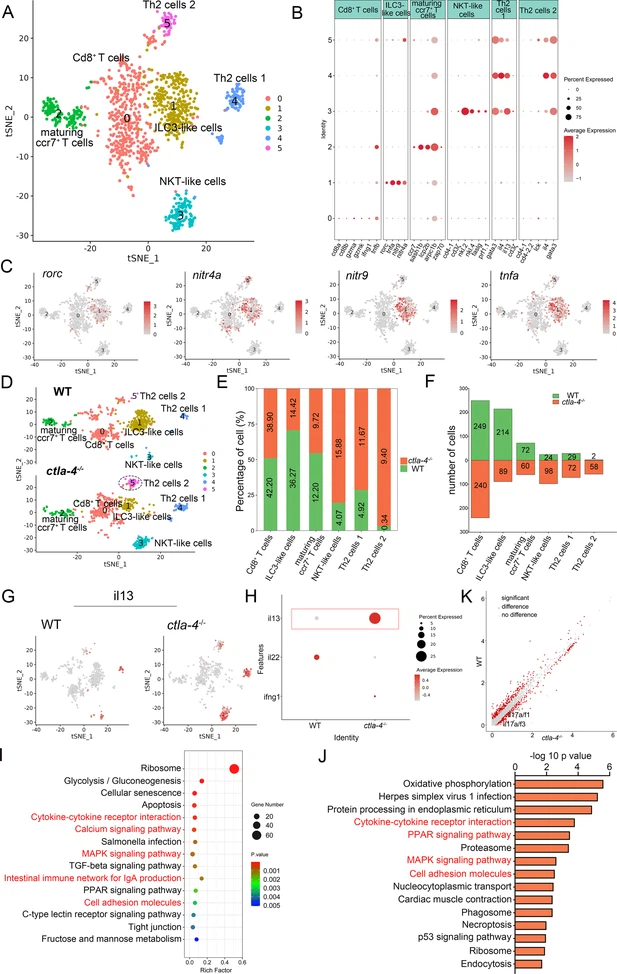
Fig. 5 Single-cell RNA sequencing analysis of the subset of immune cells associated with the inflammatory bowel disease (IBD)-like phenotype in ctla-4-/- zebrafish. (A) Classification of subset cells from the T/NK/ILC-like group by tSNE embedding. (B) Dot plot showing the mean expression levels of subset marker genes and percentage of cells per cluster that express the gene of interest. (C) Marker gene expression in individual cluster identifying this cluster as ILC3-like cells. (D) Changes in the composition of subset cells between samples from wild-type (WT) and ctla-4-/- zebrafish. A significantly increased Th2 subset (referred to as Th2 cells 2) in the ctla-4-/- sample was highlighted with a black dashed circle. (E) Histogram showing the different ratios of subset cells between the WT and ctla-4-/- samples. (F) Histogram presenting the different numbers of subset cells between the WT and ctla-4-/- samples. (G) Mean expression levels of the cytokine il13 within different subset cells between the WT and ctla-4-/- samples. (H) Dot plot illustrating the mean expression of il13 in T/NK/ILC-like cells from WT and ctla-4-/- zebrafish. (I) KEGG enrichment analysis showing the top 15 terms of the Th2 cells 2 genes from ctla-4-/- zebrafish. (J) KEGG enrichment analysis showing the top 15 terms of up-regulated genes in NKT-like cells. (K) Scatter plot showing the differentially expressed genes (DEGs) of ILC3-like cells in WT and ctla-4-/- zebrafish. The il17a/f1 and il17a/f3 was shown in the scatter plot.