IMAGE

Fig. 1

ID
ZDB-IMAGE-250609-77
Source
Figures for Eski et al., 2025
Image
Figure Caption

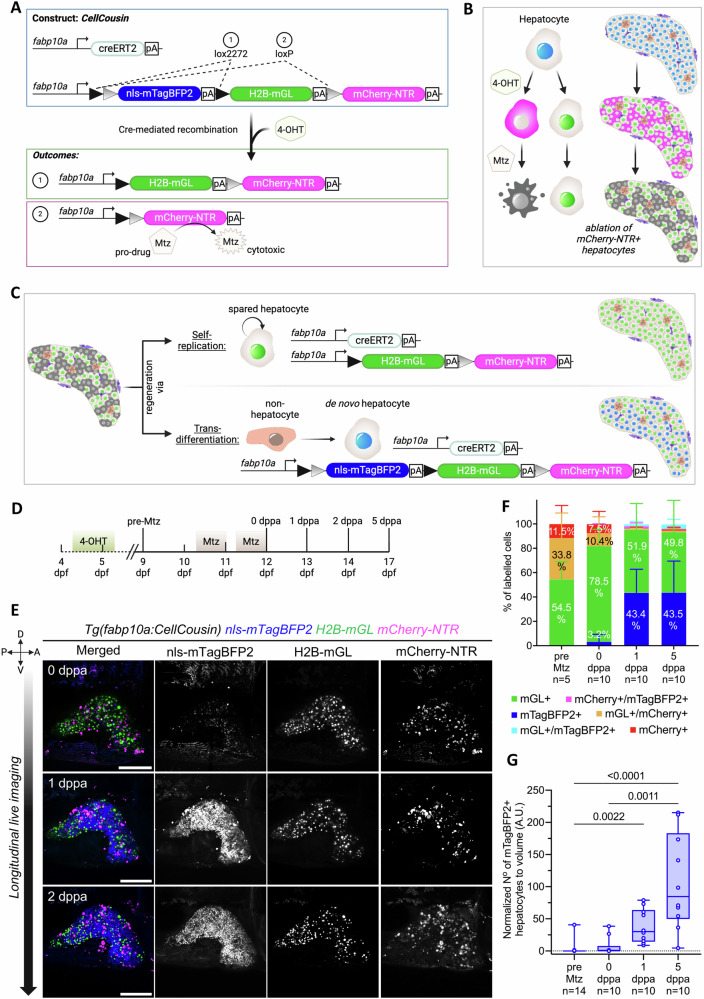
Fig. 1 CellCousin-enabled partial ablation of hepatocytes and subsequent tracking of hepatocyte regeneration.

A Schematic illustrating CellCousin construct for labeling hepatocytes by Cre/lox-mediated-recombination. B Strategy for the ablation of mCherry-NTR-expressing hepatocytes. C Schematic illustration showing the two potential modes of hepatocyte regeneration after partial ablation and the associated fluorescent labeling. D Schematic illustrating the experimental strategy. E Longitudinal in vivo confocal imaging of the same liver at 0, 1 and 2 dppa showing emergence of mTagBFP2+ hepatocytes in presence of spared H2B-mGL+ hepatocytes. Scale bar: 200 μm. F Barplots with mean ± SD of the percentage of hepatocyte labeling before (pre-Mtz, n = 5 animals) and after Mtz treatment (0,1 and 5 dppa, n = 10 animals each). G Min-to-max boxplot showing quantification of normalized number of mTagBFP2+ cells before and after Mtz treatment (pre-Mtz, n = 14 animals; after Mtz treatment (0,1 and 5 dppa), n = 10 animals each) (Kruskal Wallis test).

Figure Data
Acknowledgments
This image is the copyrighted work of the attributed author or publisher, and ZFIN has permission only to display this image to its users. Additional permissions should be obtained from the applicable author or publisher of the image. Full text @ Nat. Commun.