
|
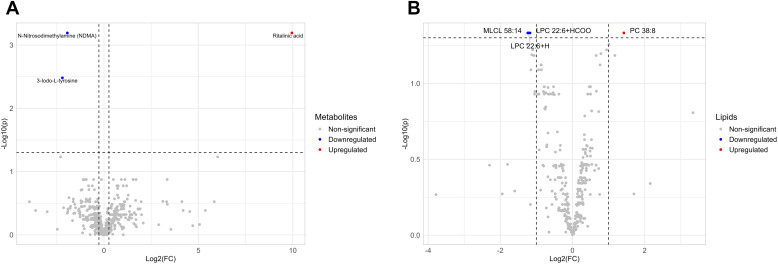
Fig. 2 The effect of stimulant methylphenidate on the whole-body metabolome of adgrl3.1 mutant larvae. Volcano plot of identified (A) metabolites and (B) lipids. Blue dots indicate significant downregulation, red dots significant upregulation, and gray dots nonsignificant changes. Comparison between methylphenidate-treated and untreated adgrl3.1 mutants revealed (A) 3 differential metabolites, 2 downregulated and 1 upregulated, and (B) 3 significantly altered lipids, 2 downregulated and 1 upregulated. Each group consisted of 3 biological replicates, with 50 pooled larvae per replicate. Differential metabolites were identified through an FC of ≥1.2 or ≤0.83 and an FDR-adjusted P value of ≤.05. Significantly altered lipids were identified through an FC of ≥1 or ≤0.5 and an FDR-adjusted P value of ≤.05.