
|
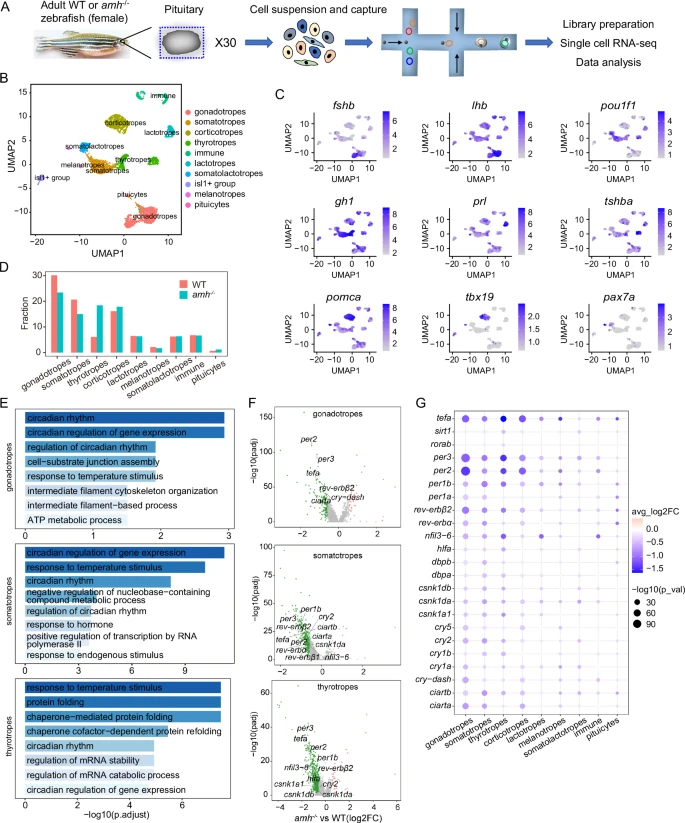
Fig. 3 Cell type-specific regulation of the molecular clock by Amh was revealed by single-cell transcriptome analysis of the pituitary.A Schematic overview of the process of cell isolation and single-cell RNA-seq analysis of the zebrafish pituitary using the 10X Genomics platform (30 pituitaries in each group, WT and amh−/−). B UMAP visualization shows the unsupervised clustering of the aggregated results of two scRNA-seq experiments, revealing 10 major clusters of pituitary cells present in zebrafish. Each dot represents one cell, and colours represent cell clusters as indicated. C UMAP visualization of cluster marker genes. UMAP, uniform manifold approximation and projection. D Bar graph showing the percentages of each cell cluster in the pituitaries of WT and amh−/− zebrafish. E Gene ontology enrichment for the downregulated genes from the major affected pituitary cell populations of amh−/− zebrafish. The top 8 terms for biological process (BP) were shown. Hypergeometric test and Benjamini-Hochberg method used for multiple comparisons correction. F Volcano plot showing differential circadian clock gene expression between amh−/− and WT zebrafish in the major affected pituitary cell lineages. G Dot plot showing the expression changes in circadian clock genes across the pituitary cell clusters from WT and amh−/− female zebrafish. For F, G two-sided unpaired Wilcoxon test and adjustments were made for multiple comparisons. Source data are provided as a Source Data file.