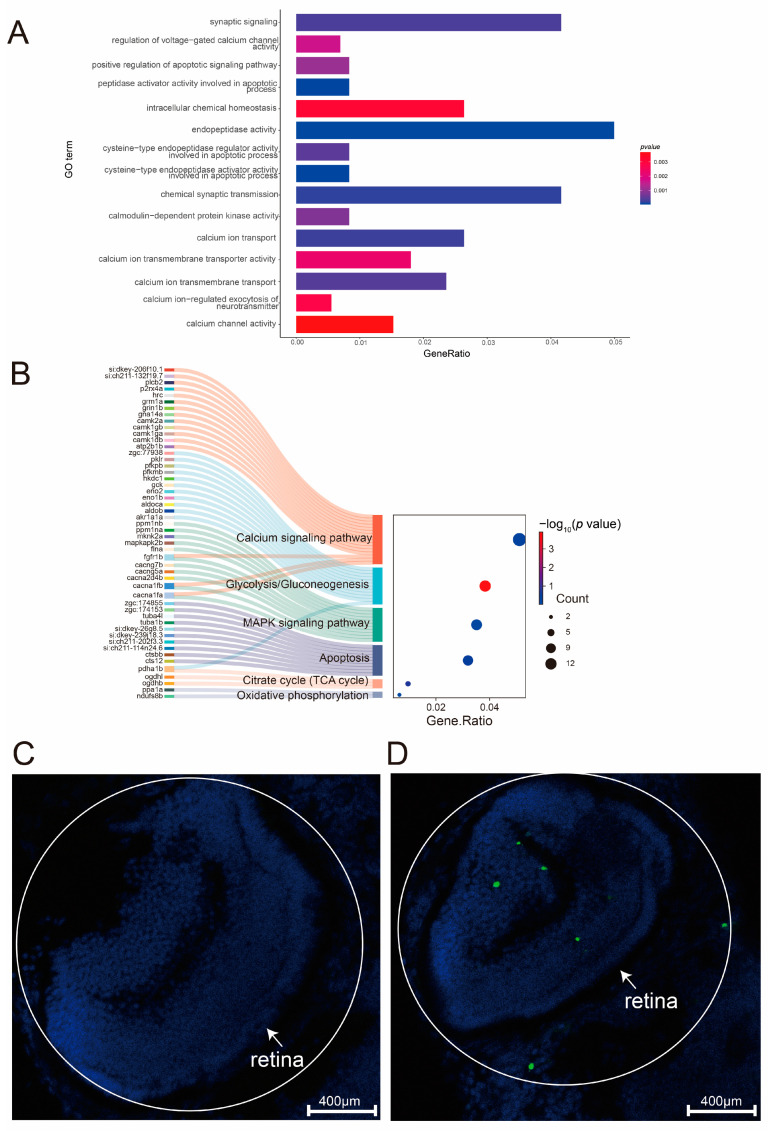
IMAGE

Figure 6

ID
ZDB-IMAGE-250530-36
Source
Figures for Zheng et al., 2025
Image
Figure Caption

Figure 6

Enrichment analysis of differentially expressed genes in cdh23−/− reveals expression of Ca2+ pathway and cell apoptosis-related pathways. (A) GO enrichment analysis reveals differential expressions. Abscissa represents Gene Ratio, which is ratio of actual enriched genes in gene set for each GO term to total number of genes. Ordinate represents various enriched GO terms. p value measures significance of enrichment, with smaller values indicating greater statistical significance. (B) Differential expression genes with KEGG enrichment. Volcano plot shows enrichment of various KEGG terms and genes enriched in each pathway. Count value represents number of genes with different enrichment results. -log10 (p value) value measures the significance of enrichment, with a higher value indicating greater statistical significance. (C,D) Increased TUNEL staining in cdh23−/− retinas. TUNEL staining (green) on cryosections of 3 dpf zebrafish retinas revealed apoptotic cells. Zebrafish larvae were embedded for transverse sectioning. Scale bar = 400 μm.

Figure Data
Acknowledgments
This image is the copyrighted work of the attributed author or publisher, and ZFIN has permission only to display this image to its users. Additional permissions should be obtained from the applicable author or publisher of the image. Full text @ Int. J. Mol. Sci.