IMAGE

Figure 3

ID
ZDB-IMAGE-250530-33
Source
Figures for Zheng et al., 2025
Image
Figure Caption

Figure 3

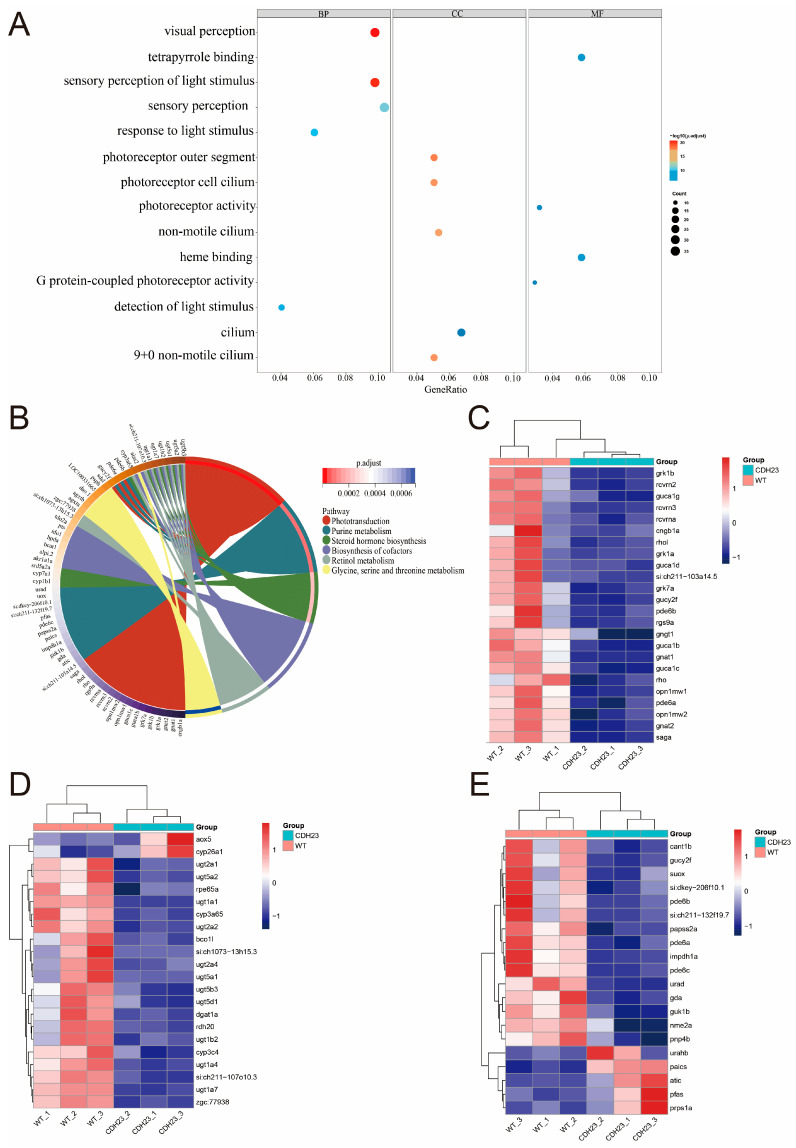
Pathways and differential gene expression associated with cdh23 knockout in relation to photoreceptor degeneration. (A) Gene Ontology (GO) enrichment analysis of differentially expressed genes was conducted across three categories: biological process (BP), cellular component (CC), and molecular function (MF). The y-axis represents enrichment of each GO term, with redder color indicating higher significance, and size of circle representing number of genes enriched in pathway, with larger circles indicating higher number of enriched genes. (B) KEGG pathway enrichment analysis of differentially expressed genes was also performed, with p-adjust value used to assess the statistical significance of each pathway. Smaller p-adjust values indicate greater significance of enrichment. (CE) Heatmap illustrating differential expression of genes involved in phototransduction, retinol metabolism, and purine metabolism pathways is presented. Vertical axis represents genes, and horizontal axis represents sample groups and control groups, with red indicating up-regulated genes and blue indicating down-regulated genes.

Acknowledgments
This image is the copyrighted work of the attributed author or publisher, and ZFIN has permission only to display this image to its users. Additional permissions should be obtained from the applicable author or publisher of the image. Full text @ Int. J. Mol. Sci.