
Image
|
Figure Caption
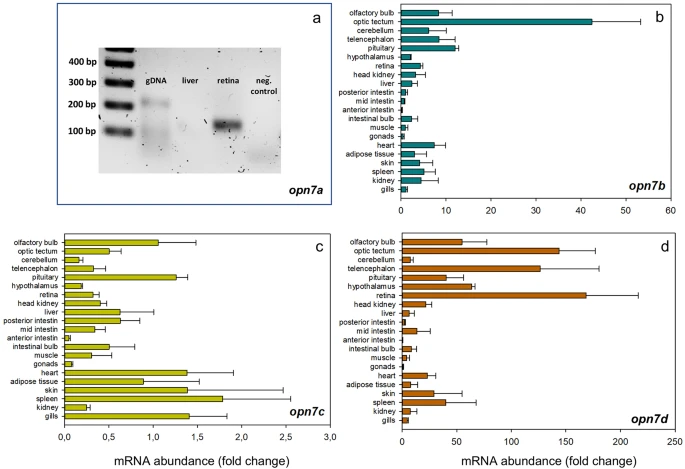
Fig. 2 Tissue distribution of representative opn7 paralogs in goldfish. (a) Agarose gel showing amplification on opn7a in the retina, but not in the liver. gDNA: genomic DNA control (no amplification because the amplicon is between two exons). Relative abundance (the value 1 was assigned to the lowest value) of opn7b (b), opn7c (c), and opn7d (d) transcripts in central and peripheral tissues. Data are expressed as mean + SEM (N = 5)
Acknowledgments
This image is the copyrighted work of the attributed author or publisher, and
ZFIN has permission only to display this image to its users.
Additional permissions should be obtained from the applicable author or publisher of the image.
Full text @ J. Comp. Physiol. A