
|
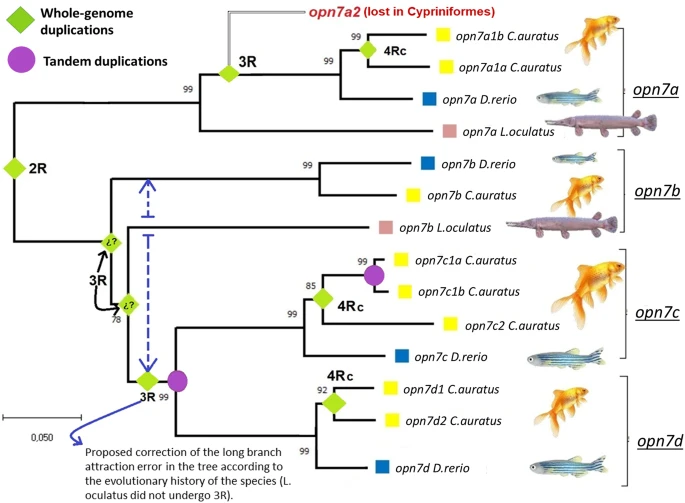
Fig. 1 Alignment of the amino acid sequences in Carassius auratus, Danio rerio and Lepisosteus oculatus. The numbers at the nodes indicate the % significance of each internal node after 1000 Bootstrap replicates. The green diamonds represent duplications of “opn7” forms during the second (2R), third (3R), and fourth (4Rc) whole-genome duplications, and the purple circles represent tandem duplications (TD). The duplication 3R with question marks does not fit the phylogenetic history of the species due to the “long-branch attraction effect”; hence, the blue dashed line proposes how the branches should be arranged. The optimal tree is shown. The tree is drawn to scale, with branch lengths in the same units as those of the evolutionary distances used to infer the phylogenetic tree. The evolutionary distances were computed using the Poisson correction method and are in the units of the number of amino acid substitutions per site. This analysis involved 21 amino acid sequences. All ambiguous positions were removed for each sequence pair (pairwise deletion option). There was a total of 530 positions in the final dataset