
|
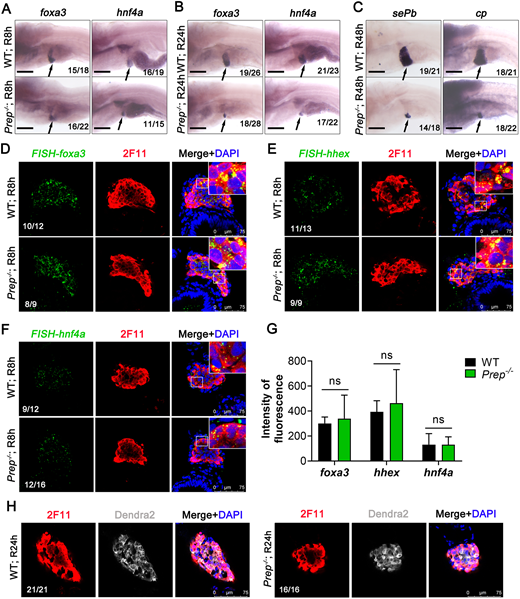
Fig. 3 Prep does not block the de-differentiation and re-differentiation of bile duct epithelial cells. (A,B) WISH images showing the expression of foxa3 and hnf4a in WT siblings and Prep−/− at R8h (A) and R24h (B). The arrow indicates the liver. (C) WISH images showing the expression of sePb and cp in WT siblings and Prep−/− at R48h. The arrow indicates the liver. (D-F) Foxa3 (D), hhex (E) and hnf4a (F) FISH and anti-2F11 staining images showing the regenerating livers at R8h. (G) Fluorescence intensity statistics of Foxa3, hhex and hnf4a FISH in the liver region. ns, not significant (two-tailed post hoc test). Data are mean±s.e.m. (F) Single-section images of anti-2F11 and anti-Dendra2 antibody staining of the regenerated livers of WT siblings and Prep−/− at R24h. Scale bars: 100 μm (A-C); 75 µm (D-H).