
|
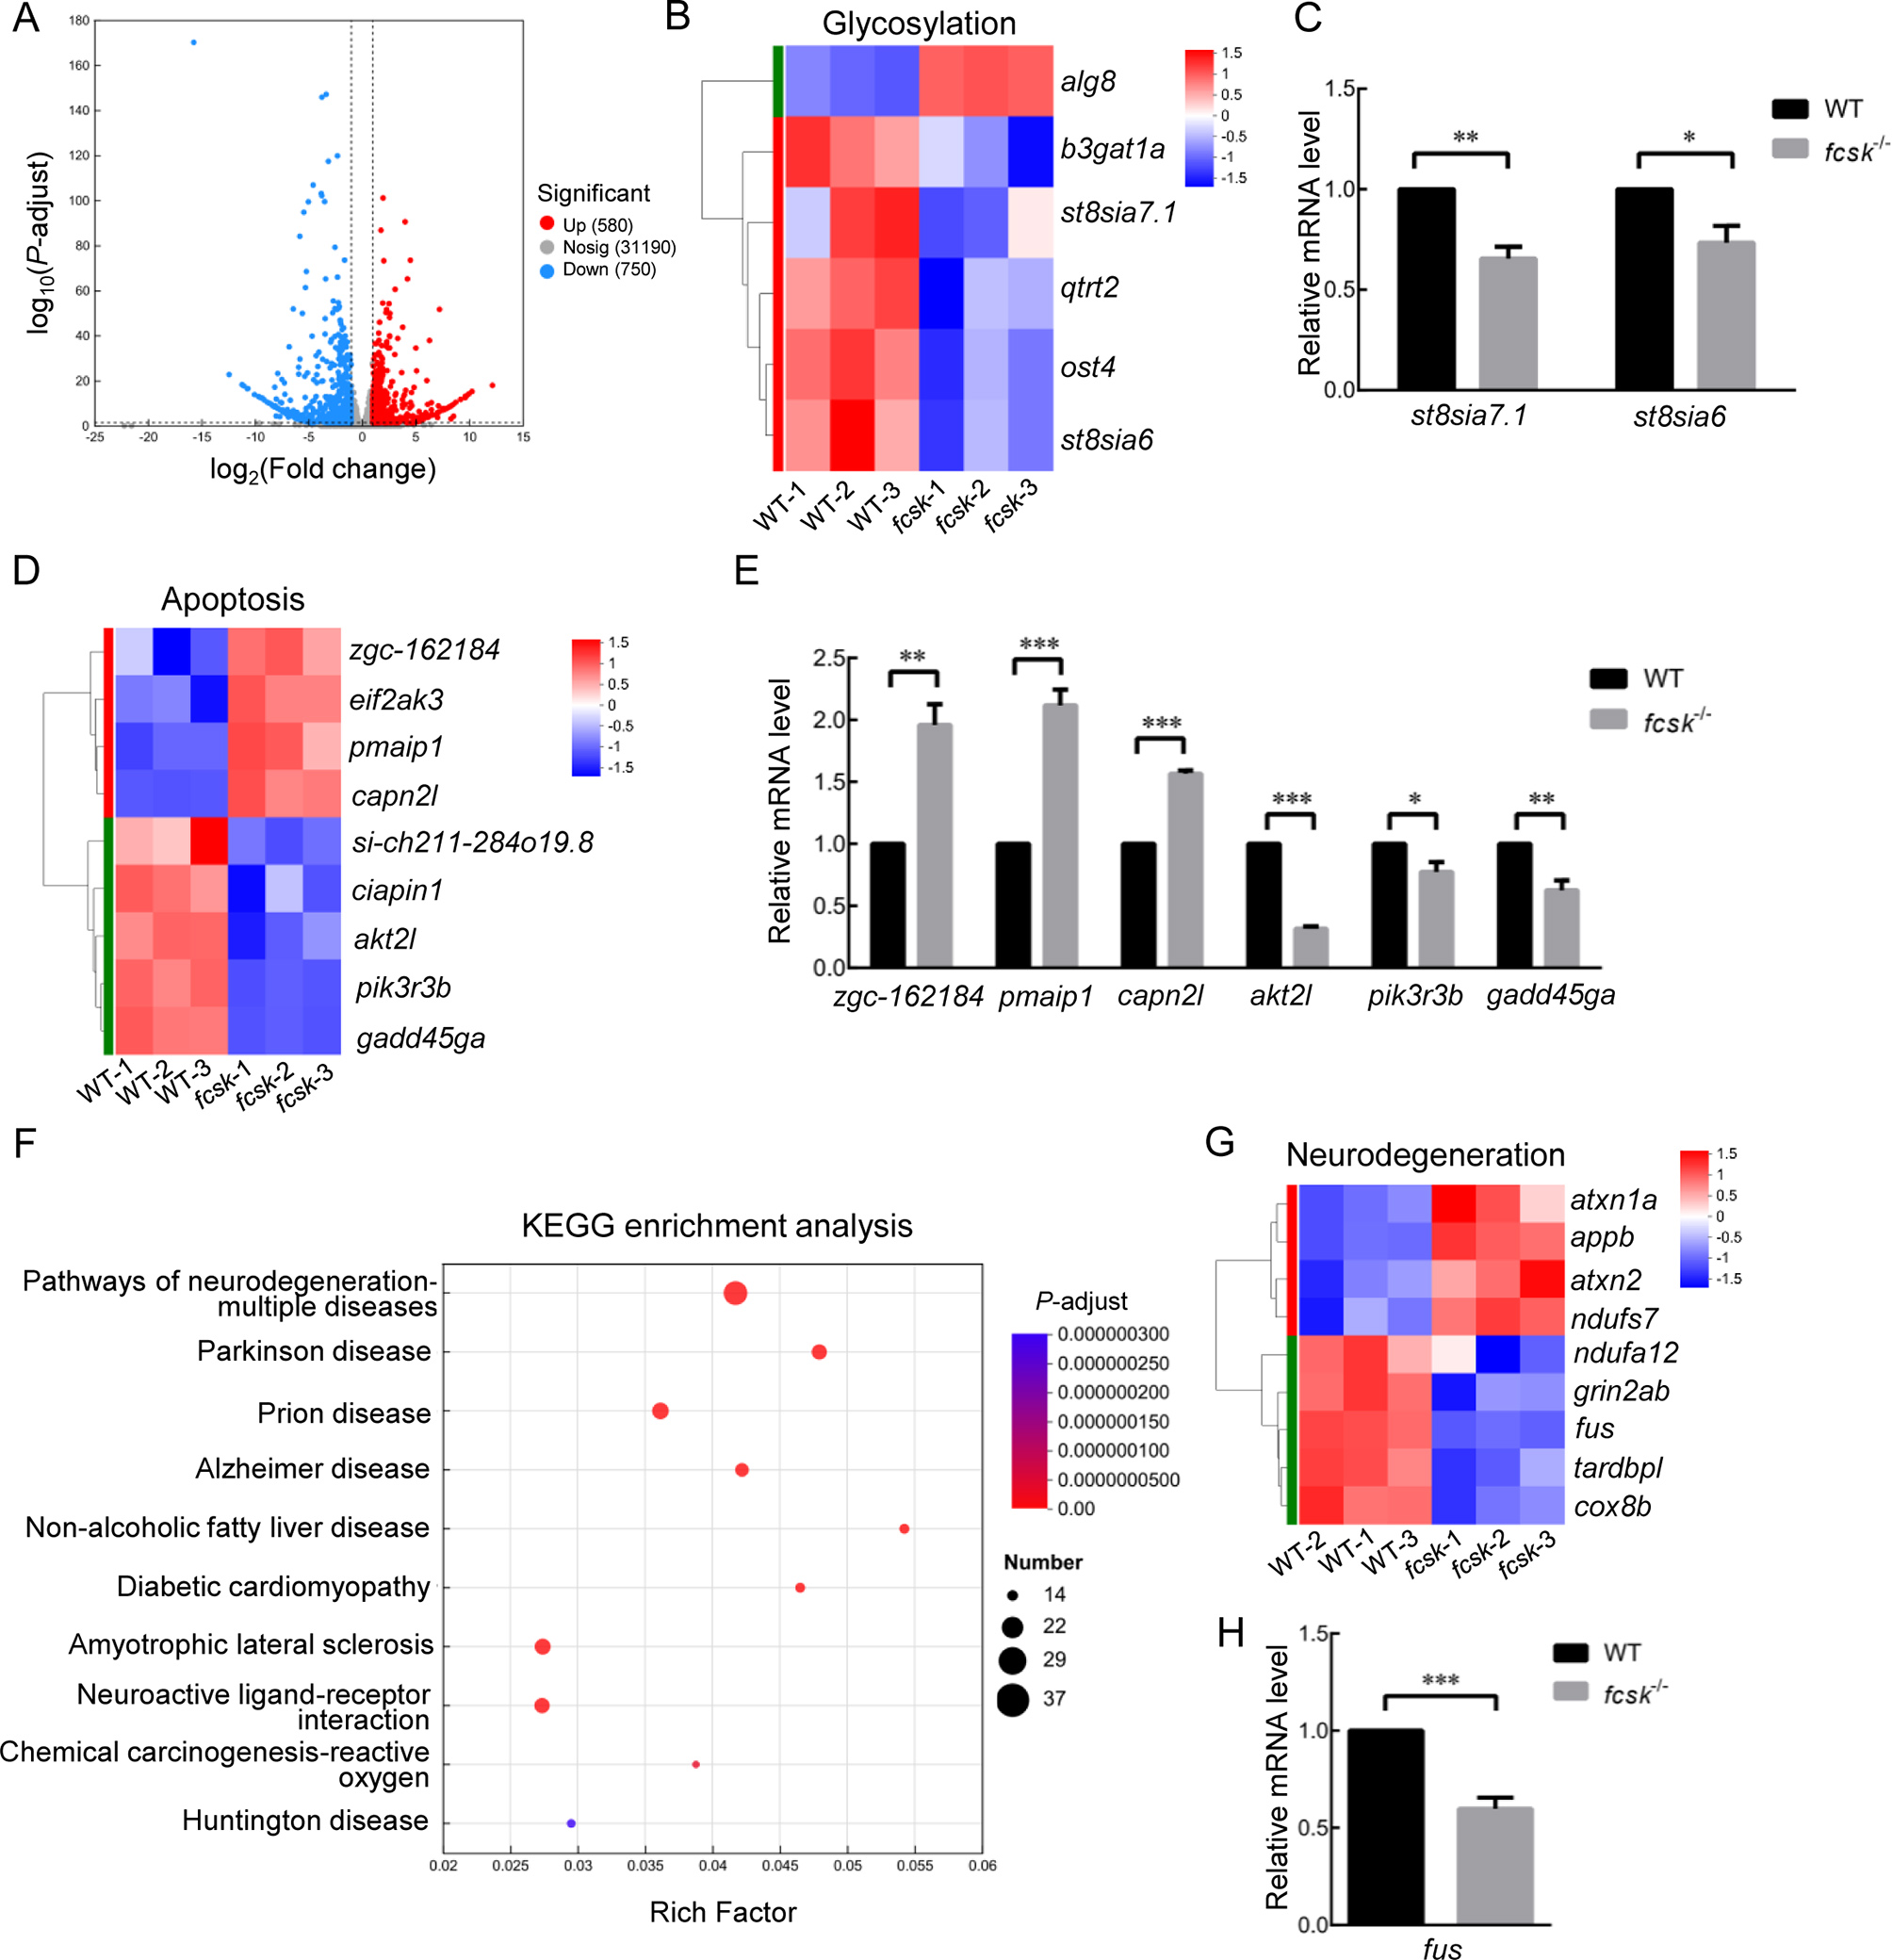
Fig. 7 RNA-seq analysis of WT and fcsk−/− zebrafish A: Volcano plot of differentially expressed genes (DEGs) between WT and fcsk−/− zebrafish. Blue represents down-regulated genes (750), red represents up-regulated genes (580), gray represents genes with no significant difference. B: Clustering heatmap of glycosylation-related DEGs. C: mRNA levels of glycosylation-related DEGs detected by RT-qPCR (n=3). D: Clustering heatmap of apoptosis-related DEGs. E: mRNA levels of apoptosis-related DEGs detected by RT-qPCR (n=3). F: KEGG analysis of DEGs related to the nervous system. G: Clustering heatmap of DEGs homologous to human neurodegenerative disease-related genes. H: mRNA levels of neurodegeneration-related DEGs detected by RT-qPCR (n=3). Mean±SEM. *: P<0.05; **: P<0.01; ***: P<0.001.