
|
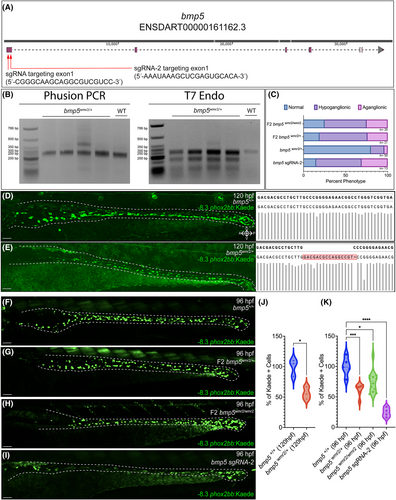
Fig. 7 CRISPR mediated mutation in bmp5 reduces − 8.3phox2bb:Kaede+ enteric progenitors. Schematic of bmp5 and CRISPR target regions, red arrows denote the location of the 2 sgRNAs (A). Agarose gel analysis of bmp5 target region amplicon via PCR and T7 endonuclease 1 activity (B). Fraction of ENS phenotypic distributions for bmp5wmr2/+, F2 bmp5wmr2/+, F2 bmp5wmr2/ wmr2, and bmp5 crispant larvae (C). Kaede+ cell reduction in bmp5 F1s at 120 hpf, and F2s and crispants at 96 hpf (E–I), when compared to bmp5+/+ ENS (D, F). The respective sequences around the targeted region of interest, with bmp5+/+ and F1 bmp5wmr2/+ containing a 16-bp insertion (D, E right). Number of Kaede+ cells of the different bmp5 F1s, F2s and crispants in the gut (J, K). ≥3 experiments with three biological replicates. T test p-value *, .0117; ANOVA p-value ****, <0.0001; ***, 0.0008; *, <.01. Scale bar depicts 50 microns.