
Image
|
Figure Caption
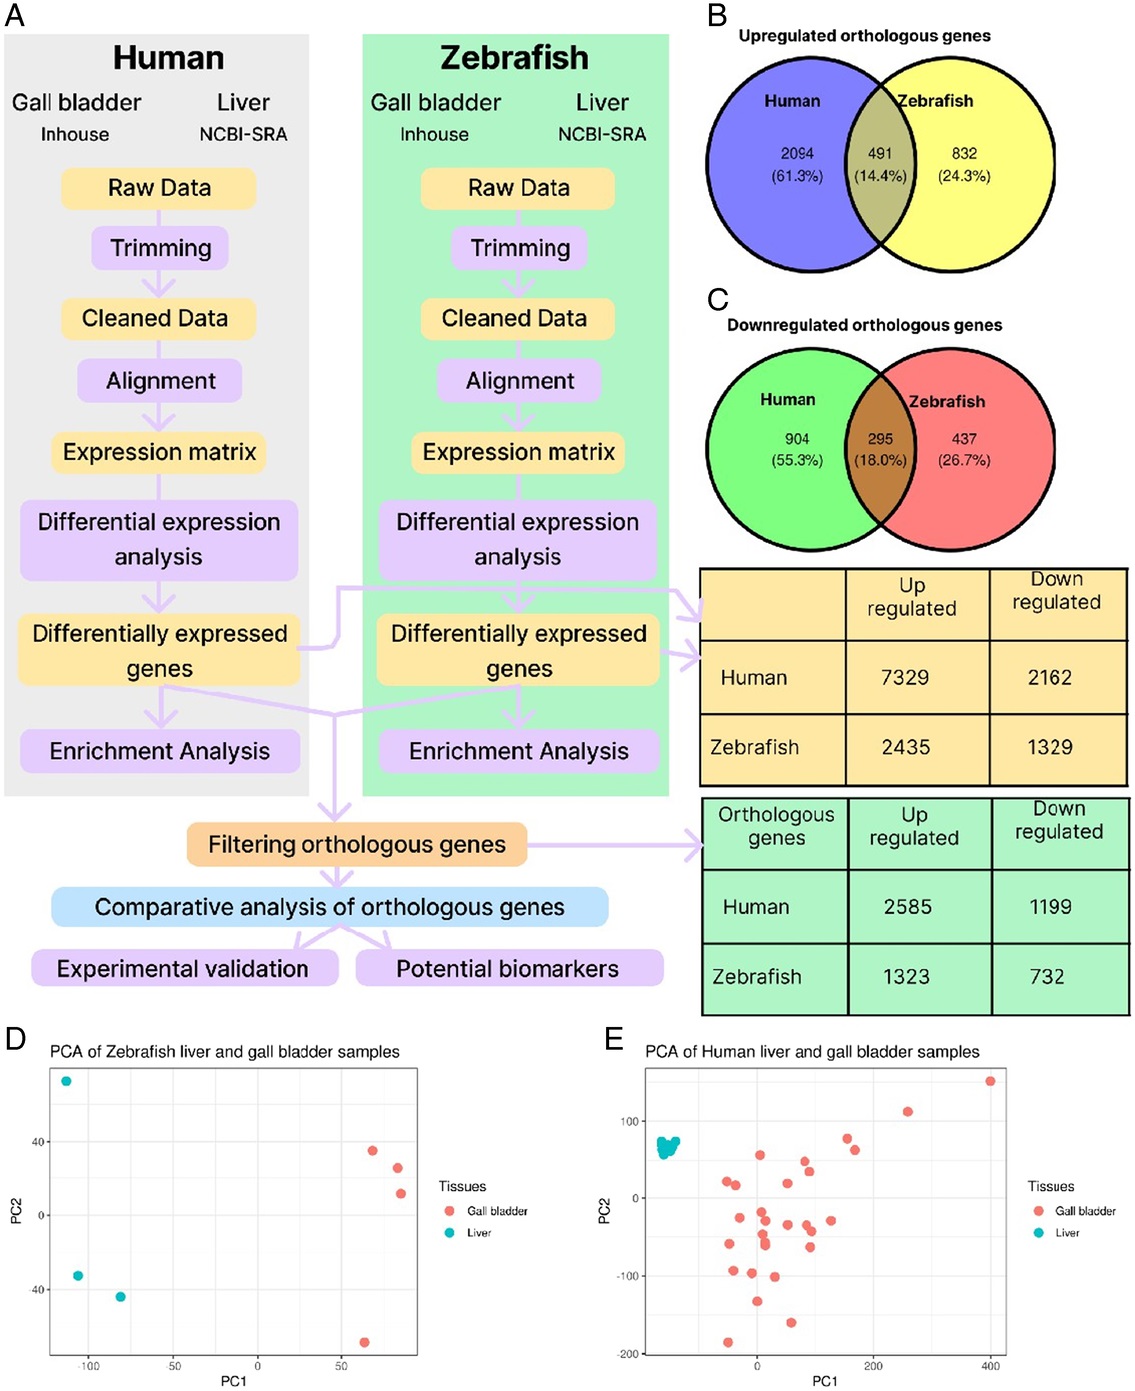
Fig. 1 (A) Schematic illustration of the biomarker identification pipeline. We began with the collection of human gallbladder and liver tissues, followed by identification and enrichment analysis of differentially expressed genes. Orthologous genes were then filtered and compared between human and zebrafish. (B) Comparison of upregulated orthologous genes in human and zebrafish (C) comparison of downregulated orthologous genes in human and zebrafish (D) PCA plot of human liver and human gallbladder samples. € (E) PCA plot of zebrafish liver and zebrafish gallbladder samples.
Acknowledgments
This image is the copyrighted work of the attributed author or publisher, and
ZFIN has permission only to display this image to its users.
Additional permissions should be obtained from the applicable author or publisher of the image.
Full text @ Int J Surg