IMAGE

Figure 1

ID
ZDB-IMAGE-250329-58
Source
Figures for Tan et al., 2025
Image
Figure Caption

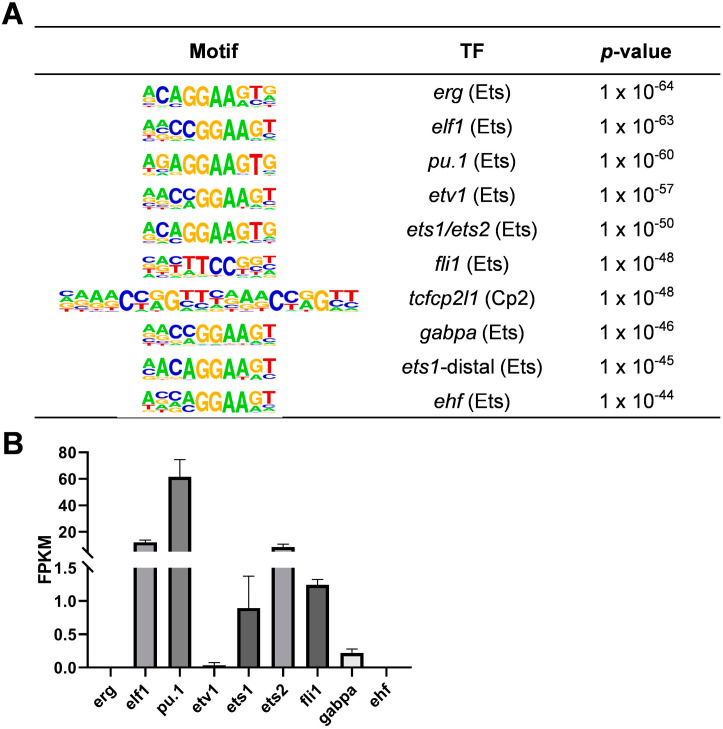
Figure 1

Transcription factor analysis of zebrafish macrophages via ATAC-seq and RNA-seq. (A) Motif enrichment analysis in zebrafish macrophages at 3 days post fertilization (dpf). The analysis reveals a strong enrichment of Ets family motifs, with 9 of the top 10 motifs belonging to the Ets family. (B) Expression levels of Ets family members in zebrafish macrophages, as determined via RNA-seq. Bar plots represent the mean ± standard error of the mean (S.E.M.).

Acknowledgments
This image is the copyrighted work of the attributed author or publisher, and ZFIN has permission only to display this image to its users. Additional permissions should be obtained from the applicable author or publisher of the image. Full text @ Int. J. Mol. Sci.