
|
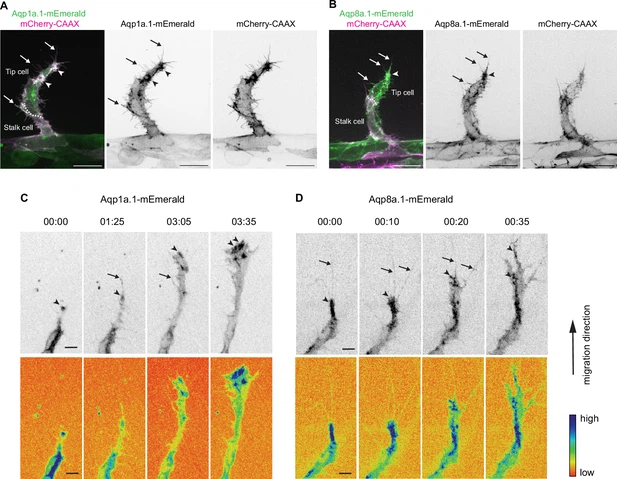
Fig. 2 Aquaporin proteins are enriched at the leading edge of migrating tip cells. (A, B) Representative maximum intensity projection confocal z-stacks of endothelial tip cells of 25 hpf Tg(fli1ep:aqp1a.1-mEmerald)rk30;(kdrl:Hsa.HRAS-mCherry)s916 (A) and Tg(fli1ep:aqp8a.1-mEmerald)rk31;(kdrl:Hsa.HRAS-mCherry)s916 (B) embryos. White serrated line outlines tip-stalk cell border. (C, D) Still images from time-lapse movies of migrating tip cells from Tg(fli1ep:aqp1a.1-mEmerald)rk30 (C) and Tg(fli1ep:aqp8a.1-mEmerald)rk31 (D) embryos. Movies were taken from 24 hpf to 30 hpf. Arrowheads, aquaporin protein localization at the leading edge of migrating tip cells. Arrows, aquaporin protein localization in filopodia. Time, hour:minutes. Scale bar, 5 µm (C, D) and 20 µm (A, B).