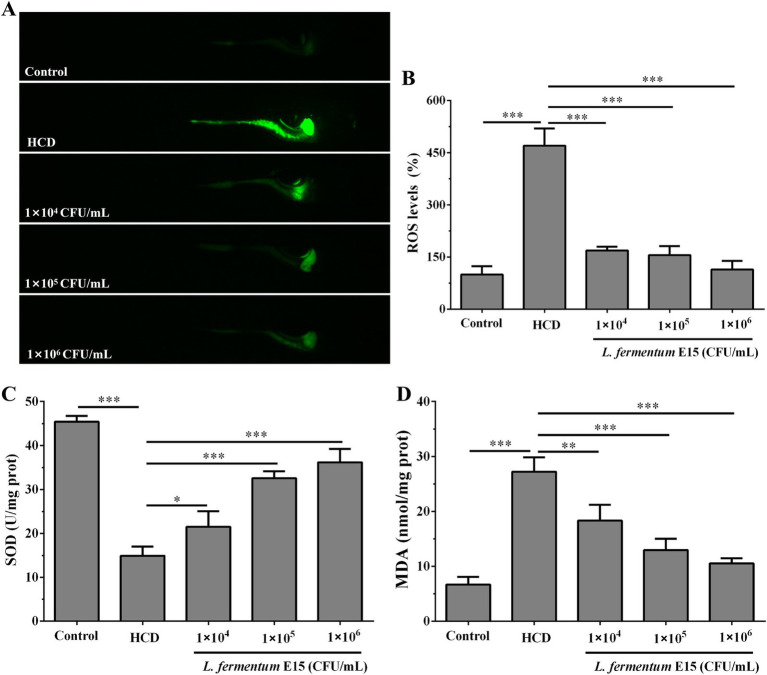
IMAGE

Figure 5

ID
ZDB-IMAGE-250318-31
Source
Figures for Chen et al., 2025
Image
Figure Caption

Figure 5

Effect of L. fermentum E15 on metabolic oxidative stress in HCD-fed zebrafish larvae. (A) Detection of ROS production in zebrafish larvae using DCFH-DA staining. (B) Quantification of ROS levels. The data are presented as mean values ± SD (n = 10). (C) SOD activity in zebrafish larvae. The data are presented as mean values ± SD of three samples (n = 10 zebrfish for each sample). (D) MDA levels in zebrafish larvae. The data are presented as mean values ± SD of three samples (n = 10 zebrfish for each sample). *p < 0.05, **p < 0.01, ***p < 0.001. p < 0.05 was considered as statistically significant calculated by One-way ANOVA followed by Tukey’s test.

Acknowledgments
This image is the copyrighted work of the attributed author or publisher, and ZFIN has permission only to display this image to its users. Additional permissions should be obtained from the applicable author or publisher of the image. Full text @ Front Nutr