
|
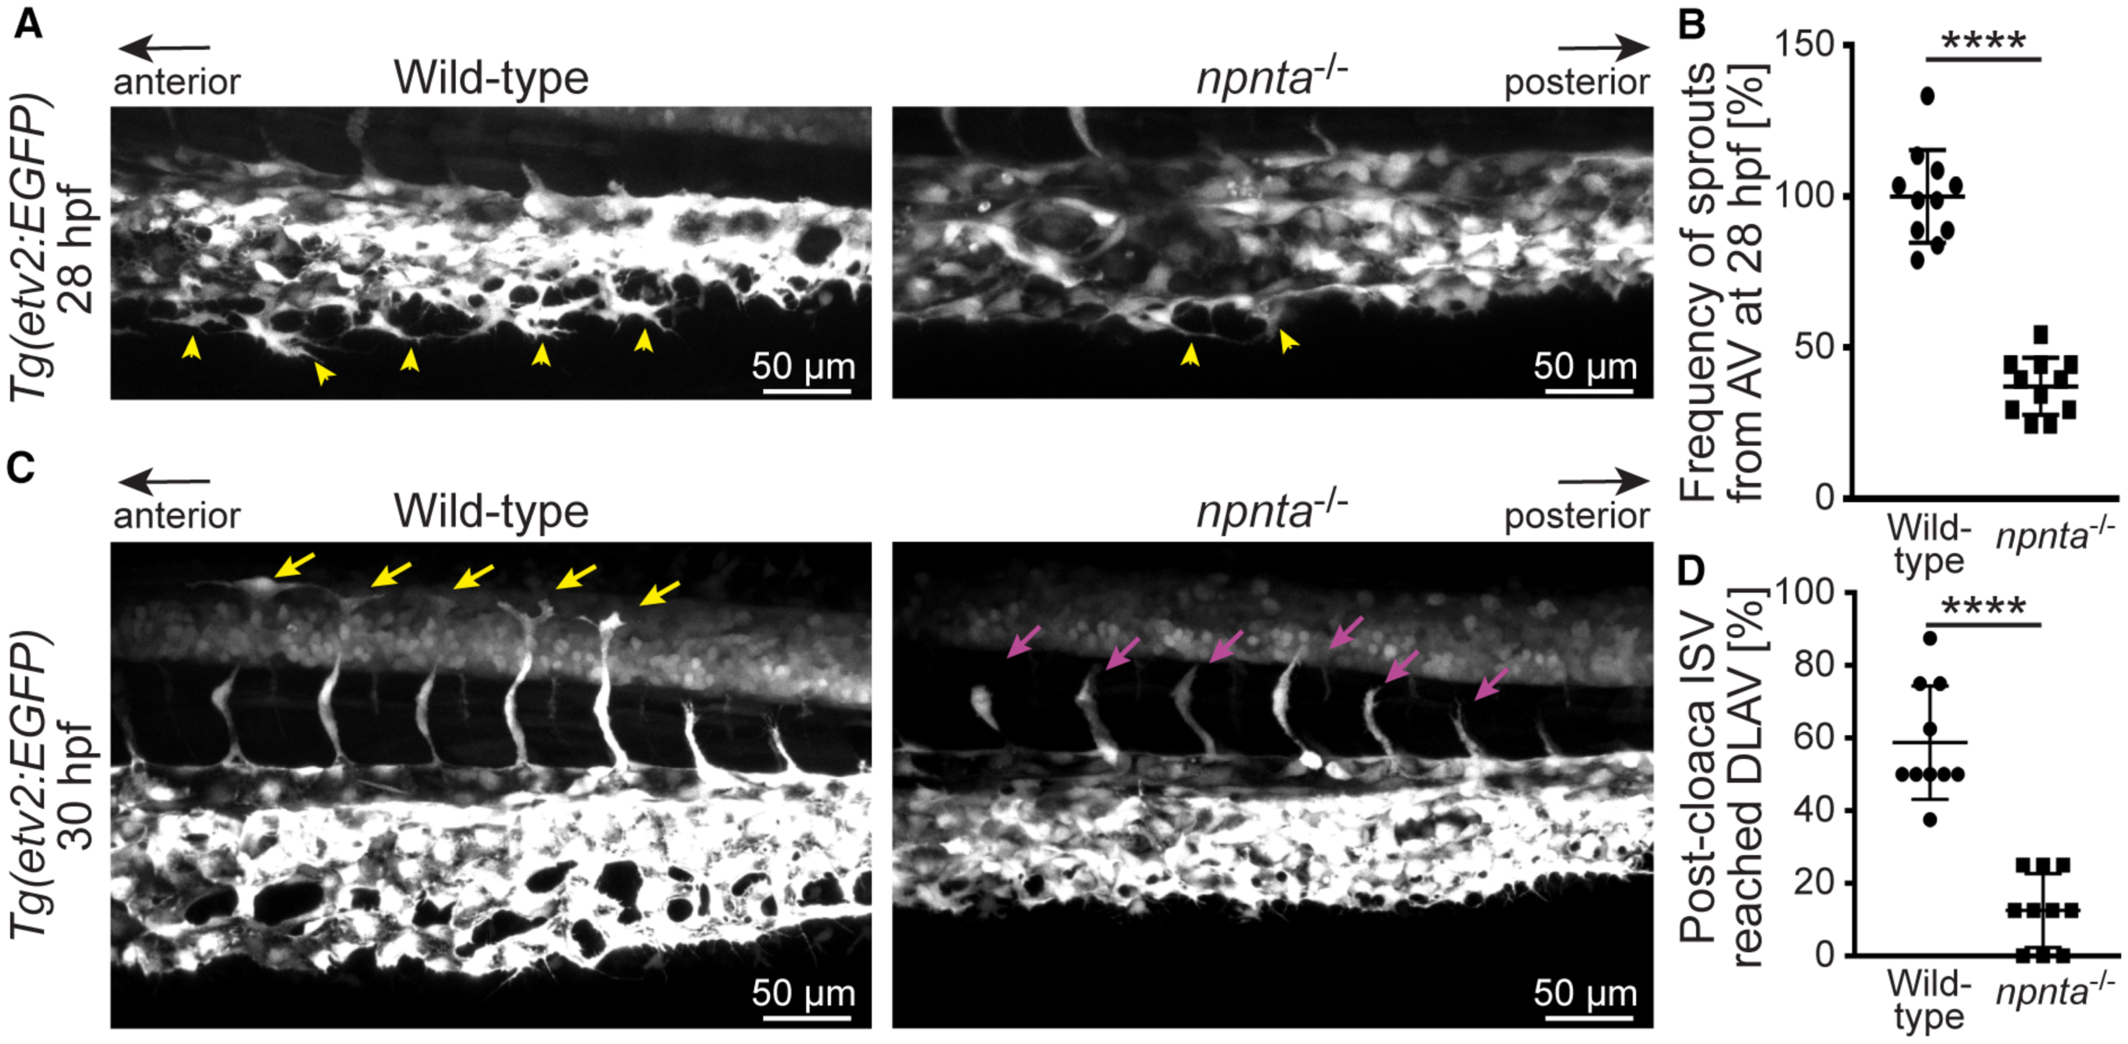
Fig. 4 npnta mutants phenocopy the axial vessel phenotypes of npnta morphants. A, Maximum intensity projections of confocal images of the caudal vein plexus forming region. Yellow arrowheads indicate ventral angiogenic sprouts at the axial vein. B, Quantification of angiogenic sprouts from AV at 28 hpf (n=11 embryos for each group). Angiogenic sprouts in the control embryos were considered as 100%. C, Maximum intensity projections of confocal images of the posterior somite region. Yellow arrows: intersegmental vessels that reached the dorsal lateral anastomotic vessel. Magenta arrows: ISVs that are yet to reach the DLAV. D, Quantification of the ISVs out of 8 post‐cloaca ISVs that reached the DLAV at 30 hpf (n=10 embryos for each group). Statistical significance in B and D was determined by a 2‐tailed Student's t test. Data are mean±SEM. ****P≤0.0001. AV indicates axial vein; DLAV, dorsal lateral anastomotic vessel; hpf, hours post fertilization; and ISV, intersegmental vessel.