IMAGE

Figure 7.

ID
ZDB-IMAGE-250307-41
Source
Figures for Liu et al., 2024
Image
Figure Caption

Figure 7.

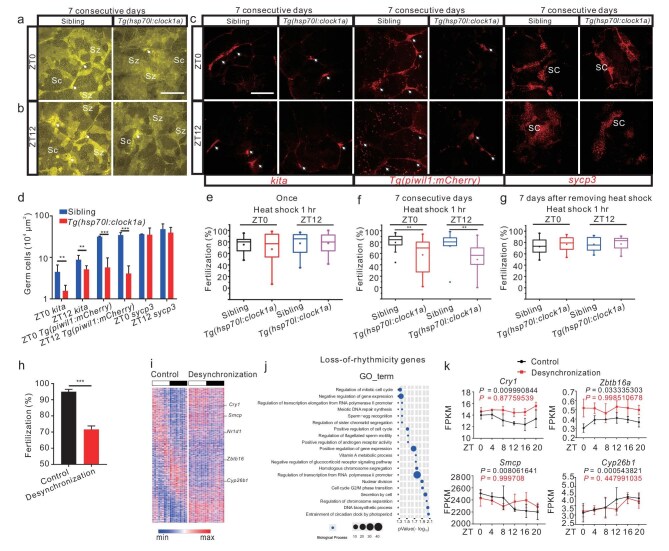
Temporally desynchronizing the circadian clock results in arrested spermatogonial differentiation and reduced fertilization in zebrafish and mice. (a and b) Confocal images of the testes from Tg(RARE-gata2a : NLS-EYFP; hsp70l : clock1a; CG2) and sibling males after heat shock at ZT0 (a) or ZT12 (b) for 7 consecutive days (n = 9–15). (c) FISH images of Tg(hsp70l : clock1a; CG2) and sibling male testes with kita or sycp3 probe, and confocal images of Tg(hsp70l : clock1a; CG2; piwil1 : mCherry) and sibling male testes, after heat shock at ZT0 or ZT12 for 7 consecutive days (n = 3 × 5). (d) Quantification of the images in (c) (n = 6 −18). (e–g) Fertilization rates by pairwise crosses of WT females and Tg(hsp70l : clock1a; CG2) males or sibling males following heat shock just once (e) or for 7 consecutive days (f) starting at ZT0 or ZT12 or 7 days after removing the treatment from heat shock starting at ZT0 or ZT12 for 7 consecutive days (g) (n = 3 × 10). (h) Fertilization rates of desynchronization and control groups’ sperms with WT oocytes by IVF (n = 3). (i) Heatmaps of loss-of-rhythmicity genes in the desynchronization and control groups. (j) Top-20 enriched GO terms BP of the loss-of-rhythmicity genes in the desynchronization group. (k) Expression of Cry1, Smcp, Zbtb16 and Cyp26b1 in the control (black) and desynchronization (red) groups. (a–c), Arrows indicate spermatogonia. Sg, spermatogonia; Sc, spermatocyte; Sz, spermatozoon. Scale bar, 100 μm. **P < 0.01; ***P < 0.001 (Figs S8 and S9).

Acknowledgments
This image is the copyrighted work of the attributed author or publisher, and ZFIN has permission only to display this image to its users. Additional permissions should be obtained from the applicable author or publisher of the image. Full text @ Natl Sci Rev