IMAGE

Figure 4.

ID
ZDB-IMAGE-250307-37
Source
Figures for Liu et al., 2024
Image
Figure Caption

Figure 4.

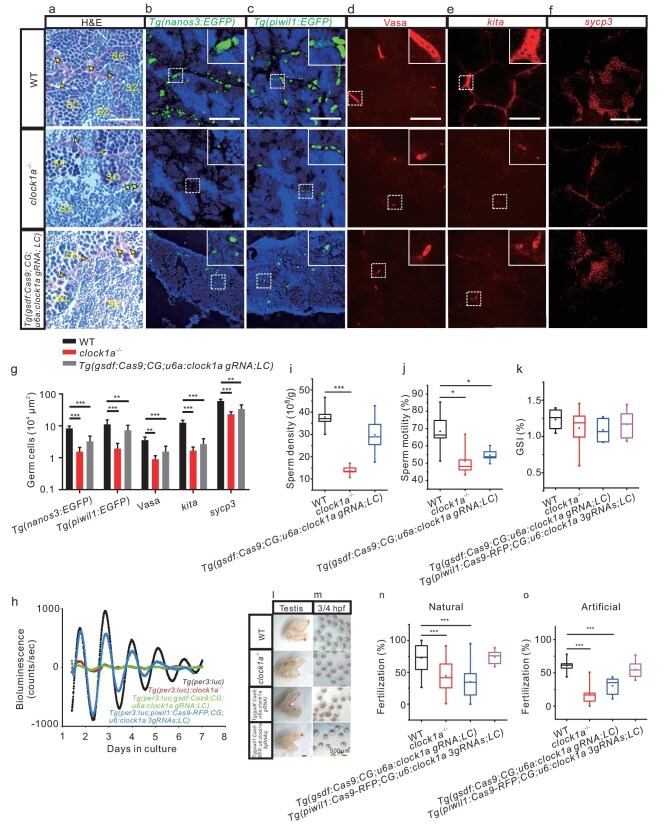
Spermatogenesis and fertilization defects in clock1a−/− and Sertoli cell clock1a mutant zebrafish. (a–f) Images of the H&E staining (a), fluorescent Tg(nanos3 : EGFP) (b) and Tg(piwil1 : EGFP) (c), IHC with a Vasa antibody (d), FISH with kita probe (e) and sycp3 probe (f) of WT control, clock1a−/−, and Sertoli cell clock1a mutant testes (n = 9–20). (g) Quantification of the images in (b–f) (n = 6–16). (h) Detrended bioluminescence recordings of the testes ex vivo from Tg(per3 : luc) (black), Tg(per3 : luc); clock1a−/− (red), Tg(per3 : luc; gsdf : Cas9; CG; u6a : clock1a gRNA; LC) (green), and Tg(per3 : luc; piwil1 : Cas9-RFP; CG; u6 : clock1a 3gRNAs; LC) (cyan) zebrafish lines (n = 3). (i and j) Sperm density (i) and motility (j) of WT control, clock1a−/−, and Sertoli cell clock1a mutant zebrafish (n = 5). (k–m) GSI (k), morphology (l), and images of fertilization at 3/4 hours postfertilization (HPF) (m) of WT control, clock1a−/−, Sertoli cell clock1a mutant, and spermatogonia clock1a mutant testes (n = 6–10). Scale bar, 500 μm. (n and o) Fertilization rates by pairwise crosses of WT control, clock1a−/−, Sertoli cell clock1a mutant, and spermatogonia clock1a mutant males with WT control females by natural crossings (n) (n = 10–24) or IVF (o) (n = 8). (a) Scale bar, 33 μm. SC, spermatocyte; SZ, spermatozoon. (b–f) Scale bar, 100 μm. (b, c) All nuclei were counterstained with Hoechst 33342. Arrowheads indicate Sertoli cells and arrows spermatogonia. *P < 0.05; **P < 0.01; ***P < 0.001 (Fig. S4 and Movie S2).

Acknowledgments
This image is the copyrighted work of the attributed author or publisher, and ZFIN has permission only to display this image to its users. Additional permissions should be obtained from the applicable author or publisher of the image. Full text @ Natl Sci Rev