IMAGE

Figure 1.

ID
ZDB-IMAGE-250307-33
Source
Figures for Liu et al., 2024
Image
Figure Caption

Figure 1.

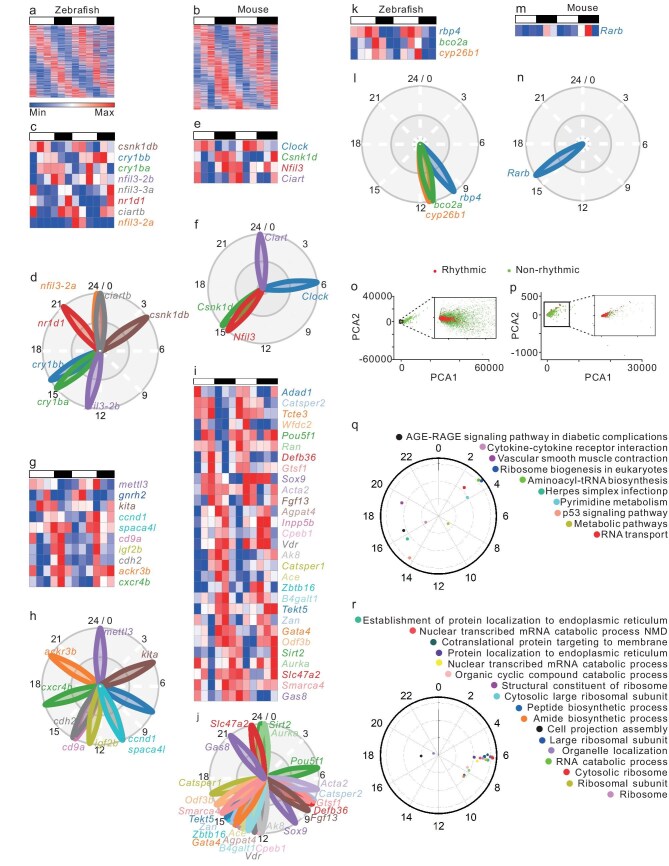
Rhythmic testicular transcriptome in zebrafish and mice. (a and b) Heatmaps of the 1082 zebrafish rhythmic transcripts (a) and 1882 mouse rhythmic transcripts (b), revealed by the MetaCycle analysis of the 12-timepoint transcriptome data (P < 0.05, n = 2 × 12). (c–n) Heatmaps and phases of the rhythmically expressed zebrafish and mouse genes involved in circadian regulation (zebrafish: c, d; mouse: e and f), testicular functions (zebrafish:g, h; mouse: i, j), and retinoic acid signaling (zebrafish: k, l; mouse: m, n). The gene names (zebrafish: c, g, k; mouse: e, i, m) and their phases (zebrafish: d, h, l; mouse: f, j, n) are color-coded and annotated. (o and p) PCA of all transcripts from the 12 timepoints in the zebrafish (o) and mouse (p) testes shows a single clustering of the rhythmic transcriptome (red dots in the enlarged panel), respectively. (q and r) Phase distribution over the 24-hour cycle of the enriched KEGG pathways in the zebrafish (q) or mouse (r) testes (P < 0.05) (Fig. S1).

Acknowledgments
This image is the copyrighted work of the attributed author or publisher, and ZFIN has permission only to display this image to its users. Additional permissions should be obtained from the applicable author or publisher of the image. Full text @ Natl Sci Rev