
|
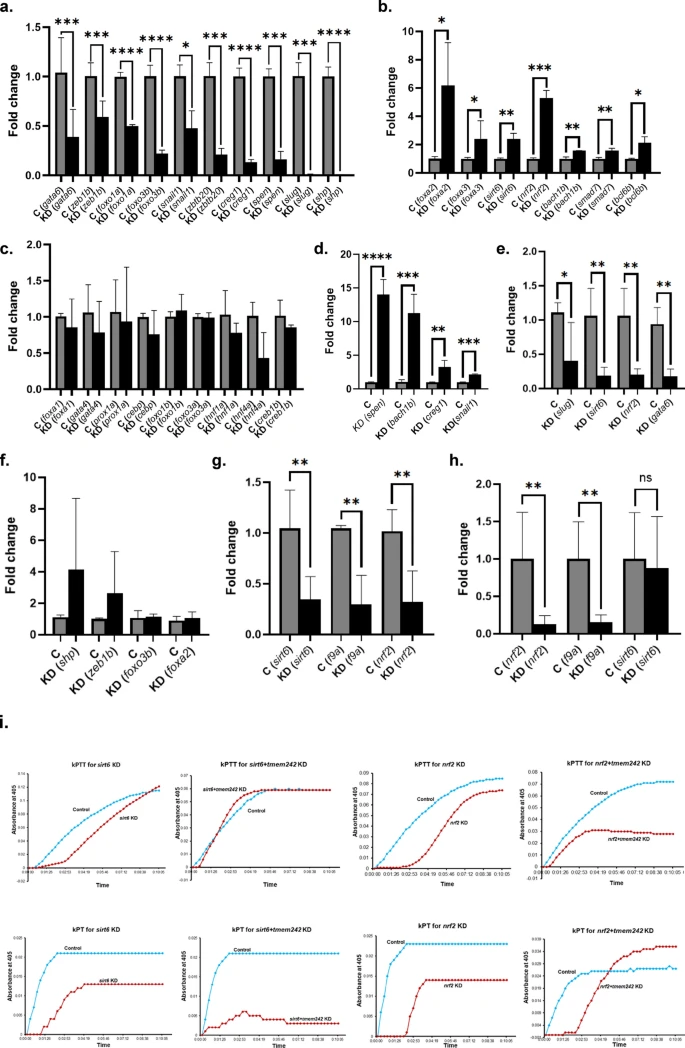
Fig. 4 Expression of hepatocyte transcription factors in tmem242 knockdown and the effect of knockdown of hepatocyte transcription factors, modulated after tmem242 knockdown, on f9a mRNA levels. (a-c) Decreased, increased, and unaltered mRNA levels of hepatocyte transcription factors, respectively, in control [C] and tmem242 knockdown [KD] zebrafish (n = 4). (d-f) Increased, decreased, and unaltered f9a mRNA levels, respectively, in control [C] and hepatocyte transcription factor knockdown [KD] zebrafish (n = 4), each hepatocyte transcription factor represented by the parenthesis. (g) The effect of sirt6 knockdown on the mRNA expression of sirt6, f9a, and nrf2 (n = 4). (h) The effect of nrf2 knockdown on the mRNA expression of nrf2, f9a, and sirt6 (n = 7). Error bars, mean ± s.d. P values were calculated by Student’s t-test. *P < 0.05, **P < 0.01, ***P < 0.001 and ****P < 0.0001; ns not significant. (i) Kinetic coagulation assays performed using the sirt6 and nrf2 knockdown individually and in combination with tmem242 knockdown zebrafish plasma. Panels represent kinetic curves of fibrin formation in kPTT (top) and kPT (bottom).