IMAGE

Fig. 7.

ID
ZDB-IMAGE-250219-52
Source
Figures for Gjorcheska et al., 2025
Image
Figure Caption

Fig. 7.

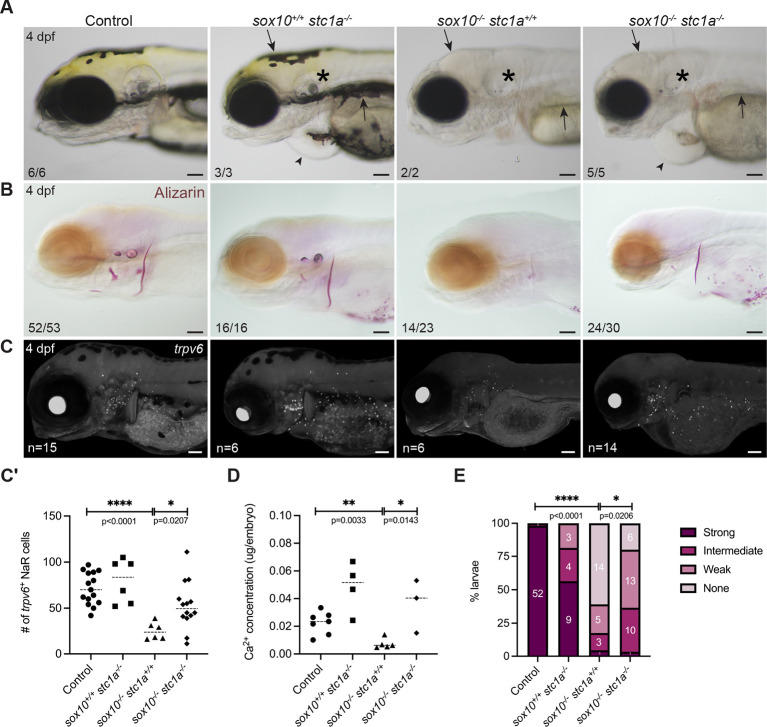
stc1a is epistatic to sox10 in control of systemic calcium content. (A) Brightfield images of sox10 and stc1a controls and mutants at 4 dpf. Double mutants phenocopy the loss of pigment (arrows) and the inner ear malformations (asterisks) of single sox10 mutants and the cardiac edema of the stc1a mutant (arrowheads). (B-C′) Loss of stc1a on the sox10 mutant background improves mineralization (B) and the number of trpv6+ ionocytes (C) at 4 dpf, quantified in C′ (unpaired t-test; P=0.0207, d.f.=18). In A,B, numbers in panels indicate the proportion of larvae of that genotype with the presented phenotype. (D) Calcium quantification shows an increase (unpaired t-test; P=0.143, d.f.=6) in calcium levels in sox10−/−; stc1a−/− compared to sox10−/−. (E) Quantitation of mineralization levels in sox10; stc1a clutches grouped based on the intensity of Alizarin Red staining. There was a significant increase in the proportion of double mutants with detectable mineralization compared with sox10 single mutants (χ2; P=0.0206, d.f.=3). In C′-E, ‘control’ includes wild-type and heterozygous larvae. Dashed lines indicate the median. Scale bars: 100 µm.

Figure Data
Acknowledgments
This image is the copyrighted work of the attributed author or publisher, and ZFIN has permission only to display this image to its users. Additional permissions should be obtained from the applicable author or publisher of the image. Full text @ Development