
|
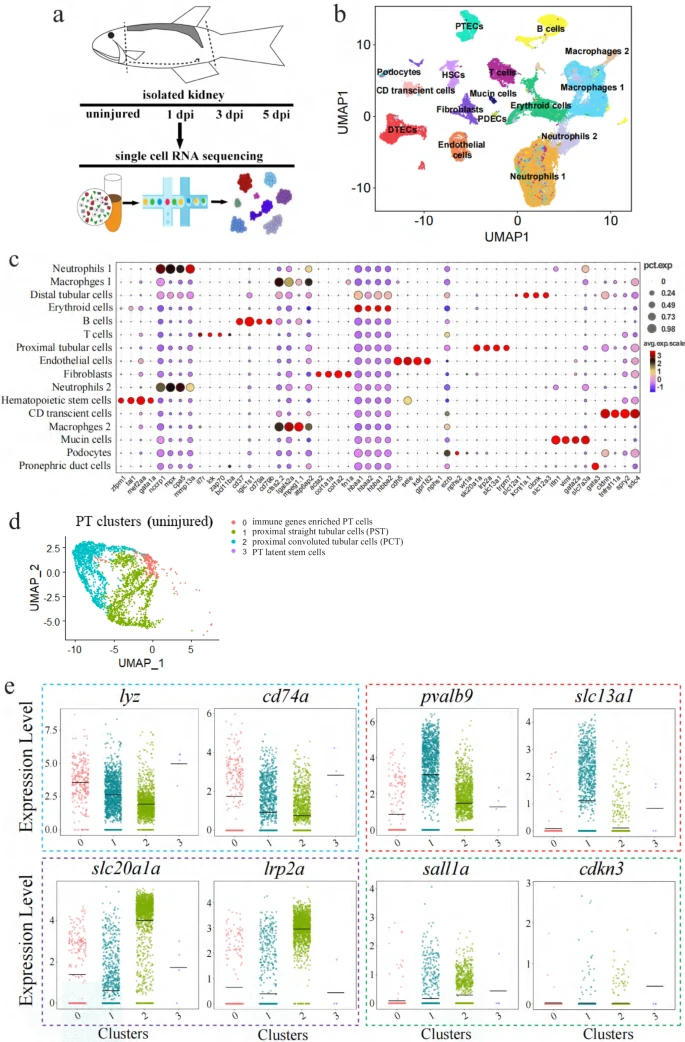
Fig. 1 scRNA-seq data analysis of zebrafish kidneys.a Schematics of the study design. b UMAP embedding of scRNA-seq data. Using kidney marker genes, cells were annotated into the indicated 16 major clusters. PTECs: proximal tubular epithelial cells; DTECs: distal tubular epithelial cells; B cells: B lymphocytes; T cells: T lymphocytes; PDECs: pronephric duct cells; PD; podocytes; HSCs: hematopoietic stem cells. c Bubble plot displaying the cluster-enriched marker genes. d UMAP projection of uninjured/wild-type proximal tubular cells (PT), demonstrating four sub-clusters. Subcluster 0: the immune gene-enriched cells; subcluster 1: proximal straight tubular cells (PST); subcluster 2: proximal convoluted tubular cells (PCT); sub-cluster 3: the resident stem cell population. e Violin plots grouped by meta-clusters, demonstrating the subcluster-specific expression of the indicated genes. The dashed colored boxes were used to indicate the markers of the four subclusters. 0–3 of the X-axis: the subclusters 0, 1, 2, 3.