
|
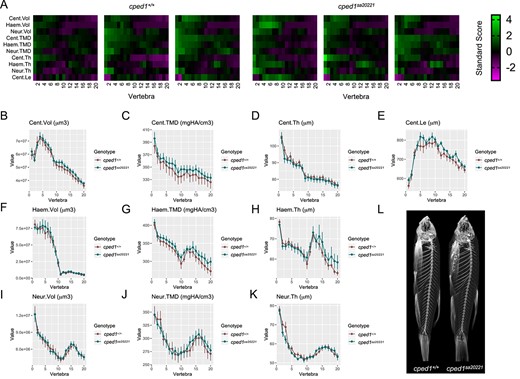
Fig. 3 cped1sa20221 mutants exhibit normal vertebral bone mass and morphology. (A) Skeletal barcodes for cped1+/+ and cped1sa20221 mutants (3 fish/group shown) visually depict individual vertebral phenomes. (B-K) Vertebral phenotypic measures (indicated by the graph title, with units for y axis) plotted as a function of vertebra along the spine. Values are depicted mean ± SEM (n = 8/group). No measures with p < .05 in the global test were detected. (L) Maximum intensity projections of microCT scans. Cent, centrum; Haem, haemal arch; Neur, neural arch; Vol, volume; TMD, tissue mineral density; Th, thickness; Le, length.