
|
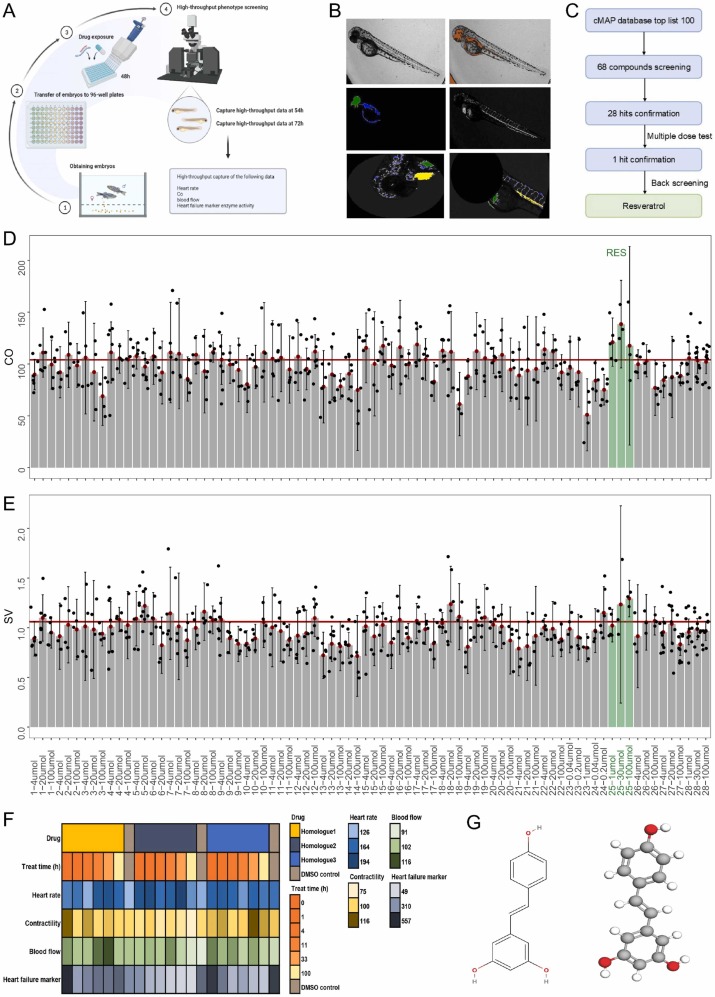
Fig. 1 High-throughput screening reveals that resveratrol alleviates heart failure in zebrafish. (A) Schematic of the drug screening process. (B) Fluorescence microscopy analysis of zebrafish heart metrics. (C) High-throughput drug screening based on the cMAP database using zebrafish. (D) Bar plot shows the screening of 28 drugs based on the indicator of cardiac output (CO). The red line represents the mean CO of HF group (= 104) and the red dots stand for the mean CO of each drug group. (E) Bar plot shows the screening of 28 drugs based on the indicator of stroke volume (SV). The red line represents the mean SV of HF group (= 1.06) and the red dots stand for the mean SV of each drug group. The bars marked in green indicate RES groups. (F) Heatmap showing the specific metrics for high-throughput drug screening using zebrafish. (G) Two-dimensional and three-dimensional structures of resveratrol.