IMAGE

Figure 6

ID
ZDB-IMAGE-250109-354
Source
Figures for Marchica et al., 2024
Image
Figure Caption

Figure 6

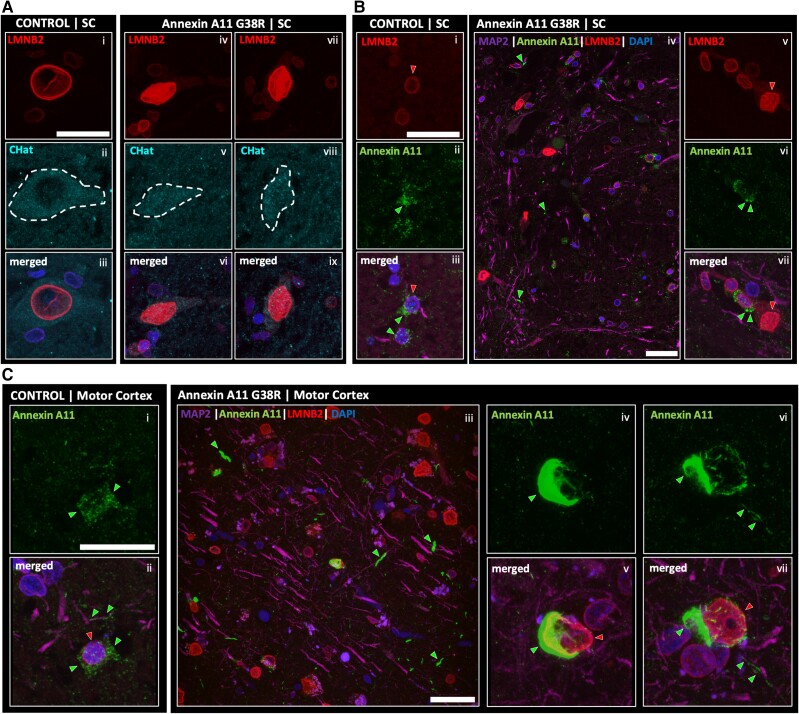
Immunostaining of Lamin B2 and Annexin A11 in controls and Annexin A11 mutant ALS+/FTD cases. (A) Immunostaining of LMNB2 in a representative control and spinal cord (SC) of anterior horn neurons from the G38R case. Tissue was stained for LMNB2, ChAT (choline acetyltransferase) to label motor neurons and DAPI. A representative ChAT positive motor neuron [A(ii)] displaying a nuclear envelope localized LMNB2 signal [A(ii and iii)]. Two ChAT positive motor neurons [A(v and viii)] from the G38R case showing abnormal nucleoplasmic LMNB2 [A(iv, vi and vii, ix), respectively]. Images presented as 3D z-stack projections. Scale bar = 50 µm. (B) Immunostaining of a representative control and spinal cord of anterior horn neurons from the G38R case displaying the difference in Annexin signal. Wild-type ring-like LMNB2 [B(i), red arrow] and cytoplasmic diffuse Annexin signal [B(ii), green arrow] in a representative control neuron [B(iii)]. Images presented as 3D z-stack projections. Single plane image from the anterior horn region of spinal cord tissue from the G38R case [B(iv)]. Neurite aggregates of Annexin can be seen (green arrows). Representative image of neurons reiterating the LMNB2 nucleoplasmic signal [B(vi and vii, red arrow)] and displaying a more punctate Annexin signal [B(vi and vii, green arrows)]. Images presented as 3D z-stack projections. Scale bar = 50 µm. (C) Immunostaining of a representative control and motor cortex neurons from the G38R case showing a marked presence of Annexin aggregation. Representative control motor cortex neuron displaying a diffuse cytoplasmic Annexin signal [C(i and ii)]. Motor cortex from the G38R case showing nucleoplasimc LMNB2 signal and neuropil Annexin aggregates (green arrows) [C(iii)]. Neurons from the G38R case motor cortex reporting heavy perinuclear Annexin aggregates [C(iv, v and vi, vii), respectively; green arrows for Annexin aggregates, red arrows for LMNB2 nucleoplasmic signal]. Images presented as 3D z-stack projections. Scale bar = 50 µm.

Acknowledgments
This image is the copyrighted work of the attributed author or publisher, and ZFIN has permission only to display this image to its users. Additional permissions should be obtained from the applicable author or publisher of the image. Full text @ Brain