
|
Figure 5
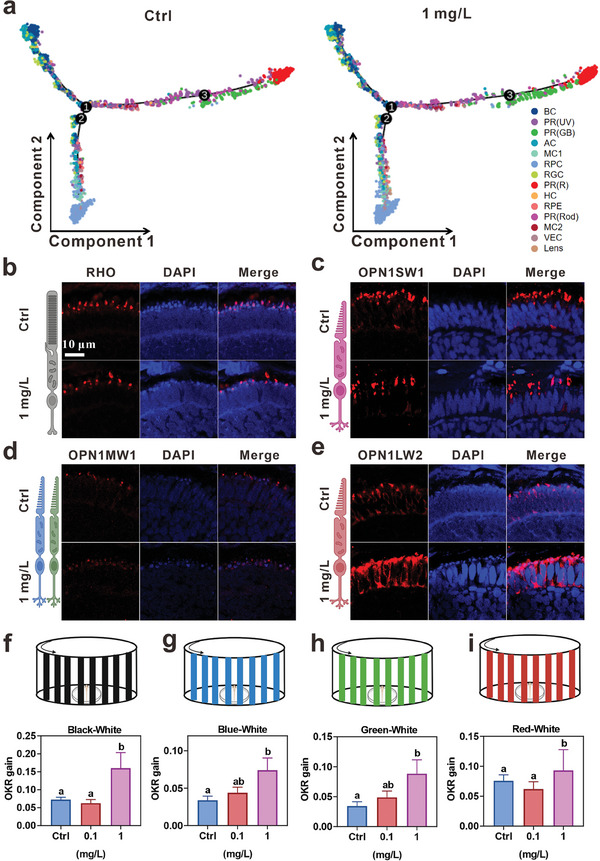
The number and function alteration of PR cells in zebrafish after exposure to InP/ZnS QDs. a) Pseudotime trajectory analysis of retinal cell development with Monocle. Each dot is a single cell and its color is agreement with its cluster assignment. b–e) The representative images of PR(Rod), PR(UV), PR(GB), and PR(R) of zebrafish at 72 hpf stained by RHO b), OPN1SW1 c), OPN1MW1 d), and OPN1LW2 e), respectively. f–i) The scheme and gain of optokinetic response (OKR) of 168‐hpf zebrafish in Black‐White f), Blue‐White g), Green‐White h), and Red‐White stripes i), n ≥ 5. The data are presented as mean ± SE. Significant change among different groups (