IMAGE

Figure 4

ID
ZDB-IMAGE-241212-83
Source
Figures for Zheng et al., 2024
Image
Figure Caption

Figure 4

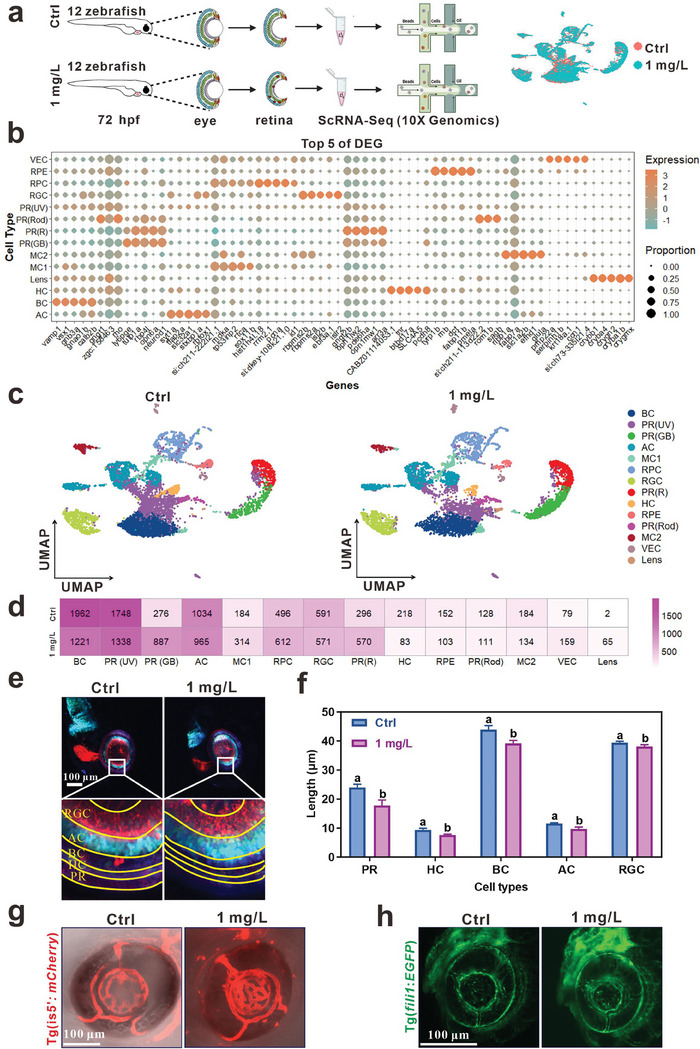
ScRNA‐seq analysis displayed the retinal degenerative damage of zebrafish exposed to InP/ZnS QDs at single cell level. a) Schematic illustration of the scRNA‐seq experimental design. We dissociated the retinas from zebrafish exposed to InP/ZnS QDs from 0.5 to 72 hpf (24 retinas of 12 larvae from each group). b) The top five DEGs of each cluster. c) UMAP plots show the clustering of qualified zebrafish eyes at 72 hpf. Distinct cell types are marked by different colors. d) The cell number of different clusters between control and InP/ZnS QDs‐exposed group. e) The representative images of the retina of Tg (Atoh7:gapRFP::Ptf1a:GFP::Crx:CFPcaax) zebrafish. f) The thicknesses of different layers of zebrafish retina were measured, n = 4. g‐h) The representative images of blood vessels in Tg (is5’:mCherry) g) and Tg (fli1:EGFP) h) zebrafish. Scale bar, 100 µm. The data are presented as mean ± SE. Significant change among different groups (p < 0.05) is indicated by the different letters on the bar.

Acknowledgments
This image is the copyrighted work of the attributed author or publisher, and ZFIN has permission only to display this image to its users. Additional permissions should be obtained from the applicable author or publisher of the image. Full text @ Adv Sci (Weinh)