IMAGE

Fig. 2

ID
ZDB-IMAGE-241206-14
Source
Figures for Pedroni et al., 2024
Image
Figure Caption

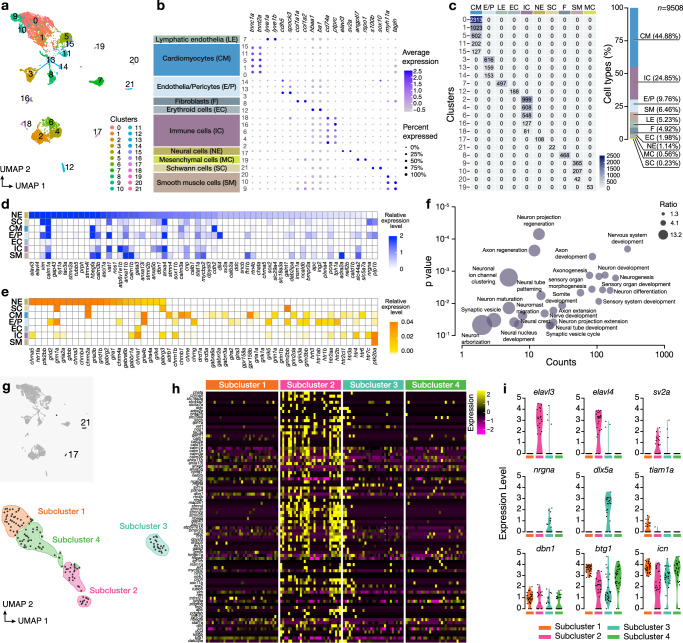
Fig. 2 Single-cell transcriptomics from the adult zebrafish heart.

a UMAP clustering plot identifies 22 cell distinct clusters colored differentially. b Dot plot of the average expression level in different cell clusters (color) and percentage of expressing cells (circle size) of selected marker genes for major cell populations (columns) across the adult zebrafish heart cells. c Heatmap for the number of cells sequenced per cell cluster. A bar plot showing the percent of cell types in single-cell samples. d Heatmap shows the expression of selected neuronal marker genes. e Heatmap presentation of the expression of neurotransmitter receptor genes in the neuronal cluster (NE) and non-neuronal clusters. f Selected gene ontology (GO) terms for neuronal cluster compared to other cell types in a multiple variable graph. The Y-axis indicates p values, and the X-axis shows the count number of genes in respective GO terms. Genes were identified through differential gene expression analyses. Bubble size indicates the odds ratio. g Subclustering of neurons (Cluster #17 and #21) identifies four subclusters (1 to 4). h Heatmap depicting the expression levels of a selected list of neuronal markers in all neuronal-related subclusters (from clusters #17 and #21). Every column indicates a cell, and every row represents a gene expression. The different neuronal subclusters are indicated and color-coded. i. Violin plots of the expression of selected genes in each distinct subcluster (color-coded).

Acknowledgments
This image is the copyrighted work of the attributed author or publisher, and ZFIN has permission only to display this image to its users. Additional permissions should be obtained from the applicable author or publisher of the image. Full text @ Nat. Commun.