IMAGE

Fig. 4

ID
ZDB-IMAGE-241205-4
Source
Figures for Bowley et al., 2024
Image
Figure Caption

Fig. 4

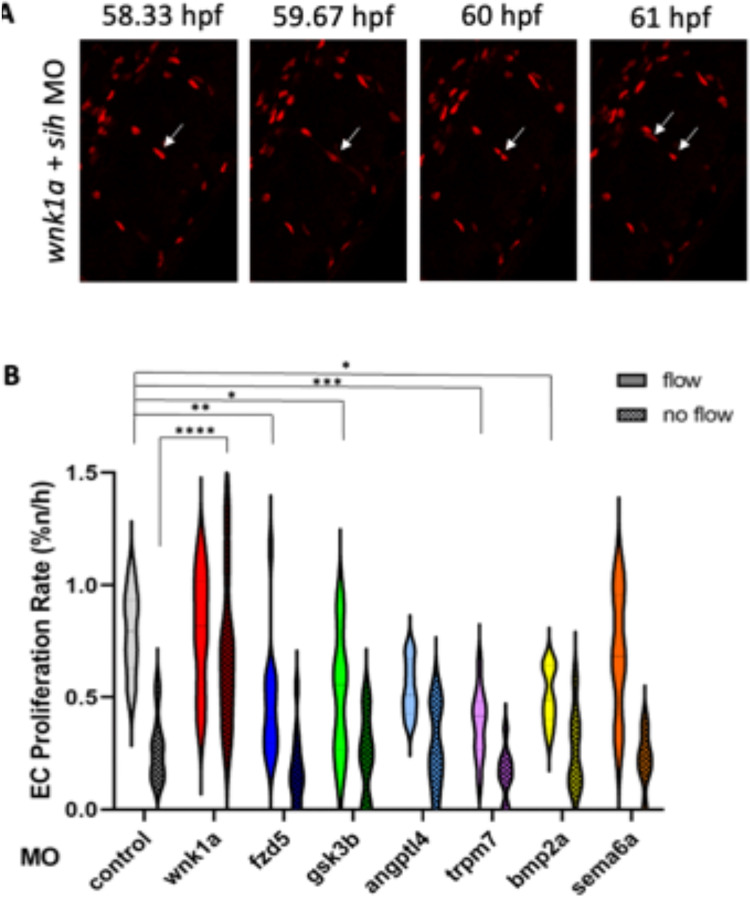
Knock-down of candidate genes influenced EC proliferation in ISVs with and without blood flow. Embryos expressing Tg(fli1a:nls-mCherry) with a gene-specific or non-targeting control MO. Some embryos were co-injected with tnnt2a-MO to prevent blood flow (no flow), whereas controls did not receive tnnt2a-MO (flow). (A) Representative images showing a dividing EC (arrows) in a wnk1a MO-treated embryo under no flow conditions. (B) Proliferation was quantified from 54 to 70 hpf in a minimum of eight embryos per condition. The rate of EC proliferation in the ISVs was quantified as a percentage of nuclei dividing per hour. Data are presented as violin plots. Differences between means were analysed by two-way ANOVA. For the no-flow condition, only significant differences are shown, with non-significant differences omitted. In the flow condition, no statistically significant differences were detected.

Acknowledgments
This image is the copyrighted work of the attributed author or publisher, and ZFIN has permission only to display this image to its users. Additional permissions should be obtained from the applicable author or publisher of the image. Full text @ Sci. Rep.