IMAGE

Fig. 5.

ID
ZDB-IMAGE-241202-29
Source
Figures for Tanaka et al., 2024
Image
Figure Caption

Fig. 5.

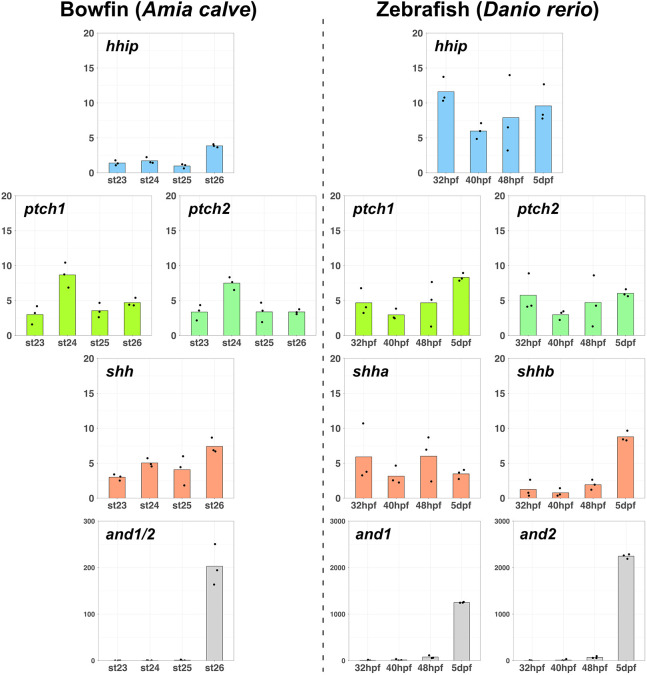
Expression patterns of hhip-related genes in pectoral fins. Bar graphs displaying expression levels (transcripts per million, TPM) at each developmental stage. The TPM of hhip, ptch, shh and and are in order from the top row. The and TPM distinguishes when fin fold formation began [bowfin, from stage (st) 26; zebrafish, from 5 dpf]. Each dot on the graphs represents the value of each replicate. The RNA-seq data of pectoral fins were obtained from previously published bowfin (Thompson et al., 2021) and zebrafish (Kudoh et al., 2024) studies.

Acknowledgments
This image is the copyrighted work of the attributed author or publisher, and ZFIN has permission only to display this image to its users. Additional permissions should be obtained from the applicable author or publisher of the image. Full text @ Development