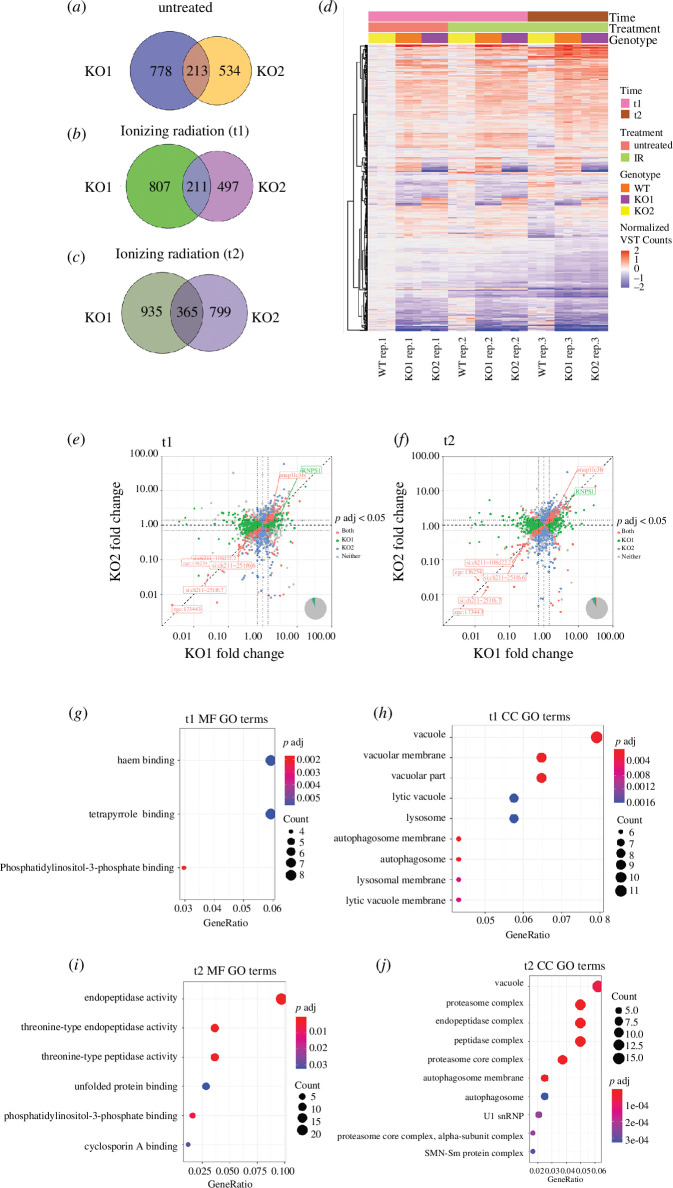
Transcriptomic analysis suggests degradation pathways are impaired in MZ-fam83fa−/− embryos (a) Venn diagram showing the DEGs in untreated MZ-fam83fa−/− KO1 and KO2 embryos compared to WT at t1 (26 hpf). (b) and (c) As (a) except IR treated embryos at t1 (26 hpf—2 h post IR treatment) and t2 (34 hpf—10 h post IR treatment), respectively. (d) Heat map of DEGs common to both KO1 and KO2 (from Venn diagram intersections above) using Euclidean distance to cluster rlog-transformed data, at conditions/times as labelled. Data displayed as normalized variance stabilized count. (e) Volcano plot of fold change in MZ-fam83fa−/− KO1 and KO2 (x- and y-axes, respectively) of genes with Padj < 0.05, at t1. Vertical and horizontal dashed lines represent no change in KO1 or KO2, respectively, diagonal dashed line represents identical fold change in both KO1 and KO2. Dotted lines represent log2 fold change threshold of ±0.5. Venn diagram in bottom right shows the proportion of genes in each category as shown in the legend. (f) Same as (e) except at t2. (g) MF GO terms for DEGs common to both MZ-fam83fa−/− KO1 and KO2 at t1 (intersection of Venn diagram in (b)). (h) Same as (g) except CC GO terms. (i) MF GO terms for DEGs common to both MZ-fam83fa−/− KO1 and KO2 at t2 (intersection of Venn diagram in (c)). (j) Same as (i) except CC GO terms. CC, cellular component; GO, gene ontology; MF, molecular function.
Acknowledgments
This image is the copyrighted work of the attributed author or publisher, and
ZFIN has permission only to display this image to its users.
Additional permissions should be obtained from the applicable author or publisher of the image.
Full text @ Open Biol.
Your Input Welcome
Thank you for submitting comments. Your input has been emailed to ZFIN curators who may contact you if
additional information is required.
Oops. Something went wrong. Please try again later.