IMAGE

Figure 2

ID
ZDB-IMAGE-241019-63
Source
Figures for Lee et al., 2024
Image
Figure Caption

Figure 2

Western blot analysis demonstrated that the recombinant Eno2-wb protein was expressed in the Eno2-knockdown cells transfected with siRNA.
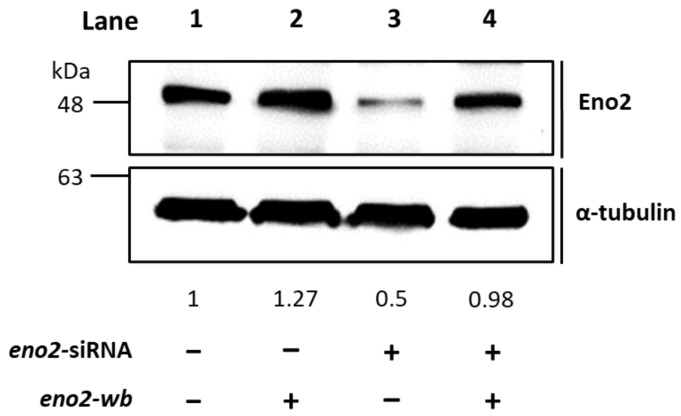
 NSC34 cells were transfected with eno2 siRNA to knock down the endogenous Eno2, followed by transfection DNA encoding Eno2 but consisting of nucleotides modified at the wobble position (Eno2-wb) to avoid the block by introducing siRNA. The expression level of Eno2 protein in the cells was detected by the Eno2 antibody. Lane 1 was the control group, and its Eno2 expressional level was set at 1, while lanes 2–4 represented Eno2 expressed within NSC cells treated without (−) or with (+) eno2 siRNA or eno2-wb. The expressional level of Eno2 was quantified relative to that of α-Tubulin that served as an internal control. The number listed below each lane indicates the fold change of Eno2 intensity of each treatment compared to the control group, set as 1.

Acknowledgments
This image is the copyrighted work of the attributed author or publisher, and ZFIN has permission only to display this image to its users. Additional permissions should be obtained from the applicable author or publisher of the image. Full text @ Int. J. Mol. Sci.